Global Economic Quarterly, Part III: Scenes From Abroad

Dragon Takeoffs
For China, a year of negative economic growth stands athwart the ethos of the Communist Party. Therefore, the Chinese economy cannot shrink. So, in 2020, when every other economy in the world endured a recession and negative economic growth, ranging from 1% to more than 11% for the year, China grew its economy by +2.3%. That represents a curious result given the significant portion of its economy tied to Global exports. However, a simple explanation exists. Chinese Non-Financial Debt to GDP rose by 23% to 26% in 2020, depending on the source, to somewhere above 285% of GDP. (Please see data from the Bank for International Settlements (BIS) at https://stats.bis.org/statx/srs/table/f1.1 , which shows China reached this level of Total Debt to GDP as of Q3 2020.) In other words, the Chinese government piled on debt, whether government or state owned enterprise (SOE) in order to meet their mandate of growth. To put this into perspective, United States Debt to GDP totals somewhere around 245% +/- 5%. (This breaks out as follows: US Government Debt at ~104%, State and Local Government Debt at 14%, Household Debt at 76%, and Business Debt at ~50%.) Certain institutions, such as the International Institute of Finance, put China’s Total Debt to GDP at over 300% prior to the Pandemic, which means China’s Debt to GDP could stand over 325% if the shadow banking system is included. For analytic purposes, the BIS data stands well respected internationally. Given that, this data will form the core of any analysis.
From this starting point, the Chinese Communist Party (CCP) laid out its growth objectives in its latest 5 Year Plan, released in early March. For 2021, the CCP targets GDP growth of “above 6%”, such that the country continues along the path prior to 2020. However, curiously, the latest CCP pronouncement contains no average growth target for the period from 2021 to 2025, unlike every other 5 Year Plan published prior. The CCP 5 Year Plan merely indicates that GDP Per Capita should reach that of “moderately developed countries” by 2035, implying a minimum growth target of 4.7%. With Global Recovery underway, the 2021 goal stands in the bag, given China’s current position in Global Supply Chains. However, the two factors highlighted above likely give the CCP reason to scale back on its growth objectives. First, the realignment of Global Supply Chains away from China will create a drag on Export Growth and on Foreign Direct Investment (FDI). As trade constitutes a significant portion of the Chinese economy, export oriented industries will move from adding to China’s growth to subtracting from it. The following chart from the World Trade Organization (WTO) illustrates the challenge China faces here:
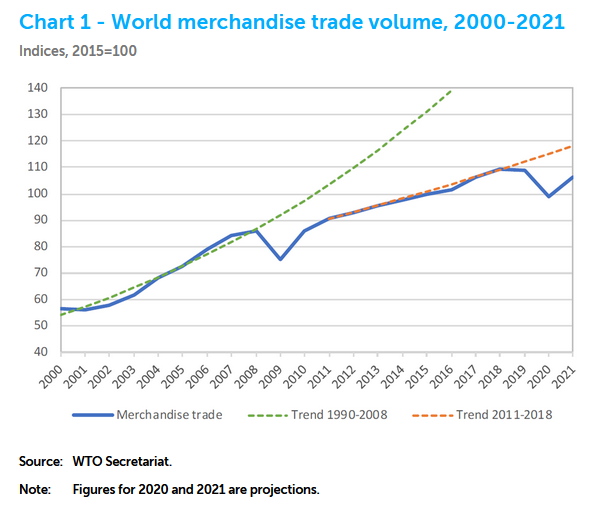
Chart courtesy of WTO. www.wto.org .
See https://www.wto.org/english/news_e/pres20_e/pr862_e.htm for more details.
As the chart above clearly illustrates, the rate of growth of Global Trade slowed significantly after the 2008-2009 Recession. And it demonstrates no growth since 2017. With China’s share of Global Trade shrinking prior to the Pandemic, such a backdrop creates significant issues with China’s traditional growth model. This model focuses on creating domestic end demand for products utilizing foreign direct investment to build out industries in the country. Once demand and these industries reach critical mass, the CCP creates domestic champions to serve domestic demand and produce extra product for export. It subsidizes the construction of these plants, then shifts demand from SOEs from foreign enterprises to the new domestic companies. The government then tariffs outside supply, providing a protected market for its companies, ensuring profitability. This supports Investment and ensures a Trade Surplus. China’s recent build out of 20% of global polycarbonate production stands a simple example of this strategy.
Second, utilizing debt to create growth works to a point. When fundamental growth slows, typically, a country or a company, looks for new sources of growth. This can occur by moving into new products to sustain growth or by entering whole new industries. For the past 20 years, China drove its economy by entering industry after industry. Initially, this growth self-funded, due to the strong returns it generated. However, asset returns began to fall after the 2008-2009 Recession, as China entered industries where it possessed no competitive advantage. And new countries began to displace products that required cheap labor. Despite this, China continued to target the same growth rate for its economy. In order to sustain this growth, China needed to take on Debt at an accelerating pace. Thus, overall Debt to GDP soared over the past decade as the following chart illustrates:
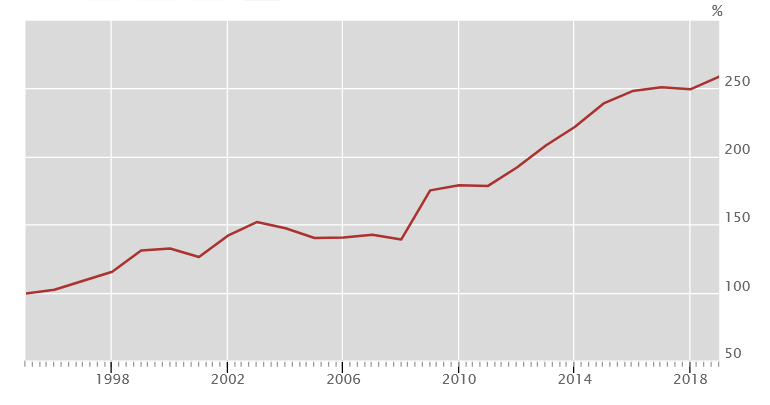
Chart courtesy of www.bis.org.
China’s Total Debt to GDP, which stood at ~175% in 2009 after the prior Recession, now stands at 285%+. And with Debt growth exceeding GDP growth over the past decade by a ratio of 2 to 1, China faces a true challenge going forward. If Investment Growth merely matches that of the past decade and Debt Productivity stays the same, unlike the past 10 year history of falling productivity of debt, then China’s Total Debt to GDP would exceed 385% by 2035 to meet its GDP Per Capita goal. This stands an unsustainable level for any country.
For China, economic growth will continue at historical rates in 2021 and 2022. China’s current position in Global Supply Chains almost guarantees such an outcome. However, longer term growth stands at risk as Global Supply Chains move to exclude China. With a Dragon Takeoff in process, the question remains as follows: what altitude can the country achieve for economic growth before being forced to return towards the ground.
Elephant Stampedes
For India, after a rough Fiscal 2021 Year (the Indian Fiscal Year ends in March), the Fiscal 2022 Year (calendar 2021 Year) should produce the strongest growth in decades. Real GDP Growth may hit 14% or more. At the same time the long term Property Cycle may have bottomed and the Government appears set to increase the deficit to boost capital spending by 26%. Should India’s fundamental growth find itself aided short term by increased government spending and long term by the turn in the Property cycle, India could produce strong growth for many years. Already, bank credit growth began to accelerate. After peaking at 15.1% in late 2018 Year-Over-Year (YOY) it fell to just 5.0% YOY in September 2020. However, since then the growth rate took a steady path upward reaching 6.7% YOY in January. In addition, Industrial Production stood at 97% of its pre-Pandemic level in January. With the economy continuing to open up, growth should continue to accelerate.
The real cherry-on-top of the Ice Cream Sunday could prove the Property cycle. The Residential Housing cycle peaked in calendar 2012 at more than 9% of GDP with Residential Area Sold in the Top 7 Cities at over 400 million square meters. As demand slowed, steadily dropping to under 300 million square meters in 2017, Inventory built, peaking at over 1,000 million square meters in 2015 and 2016. This represented over 3 years of Inventory. Demand picked up in 2018 and 2019, with the cycle appearing to turn. Unfortunately, the Pandemic undercut this turn, returning the market to 2017 levels. However, despite the hit to demand for space in 2020, Inventory continued to drop, falling below 800 million square meters in 2020 for the first time since 2012. With Residential Affordability at its best levels since Fiscal 2004 (calendar 2003), calendar 2021 demand should rise strongly as the economy continues to reopen. This should drive Inventory down further.
Over the past 5 Years, Residential Housing Investment created a 06% – 0.7% per year drag on GDP Growth. A turn would add 1.2% – 1.4% per year to GDP Growth. In addition, as demand rises for all the inputs into Residential Housing, further Investment into plant to deliver everything from windows to doors to drywall should occur. This should further aid Indian GDP Growth. More Investment will come from the Government’s recently announced major capex cycle for roads, railways, communications, and other needed infrastructure. And with the economy reopening over the next 12 months, as the COVID Pandemic either burns itself out or succumbs to vaccines, an Elephant Stampede lies ahead.
The Rising Sun Again
For Japan, a long quarter century appears over. While GDP growth over the past 25 years approximates zero, policy changes coupled with fundamental economic changes should enable Japan to finally grow on a long term basis. The source of Japan’s malaise stems from its massive overreliance on exports. And while investors still perceive the economy as export driven, the reality differs. The economy continues to move towards a more sustainable model, with domestic consumption playing a much larger role. In addition, it appears the Bank of Japan (BOJ) will support the economy through explicit monetization of government spending. Since 2012, monetization of the Japanese government’s budget underwrote anywhere from 20% to 80% of government spending, averaging somewhere in the middle. This massive pumping of cash into the economy appears to finally be working its magic. Inflation continues to move up slowly, starting to drive Nominal GDP upward. Given that Japan’s Government Debt to GDP exceeds 240%, monetizing debt while maintaining interest rates near zero will enable the country to grow out of its debt over time. When coupled with a cyclical recovery, this dynamic should mean The Rising Sun Again for the country.
Delayed Samba
For Brazil, the Pandemic continues on. Unlike Europe, the US, Japan, China, and Southeast Asia, cases continue to rise to all time highs. According to Medicines Sans Frontieres, Brazil possesses the poorest government response to addressing the disease. Despite this humanitarian disaster, Brazil should still eke out 3%+ real growth this year, driven by a global recovery. With Brazil a major commodity exporter and industrial commodity prices and demand strongly responding to all the stimulus created around the globe, Brazil cannot help but benefit from this turn. However, given that GDP fell over 4% in 2019, this will still leave the economy below where it stood in 2019.
Old Man Hopes
For Europe, vaccine supply issues continue to harass an otherwise clear exit from the Pandemic. And while vaccine issues, such as Astra Zeneca’s blood clots and J&J’s latest travails, continue to make front page news, the vaccination numbers continue to rise. With the physical number of doses available from alternatives to the Astra Zeneca vaccine headed much higher, Europe should complete vaccinating its populace by the end of Q3. Thus, Europe’s reopening will run just 1 Quarter behind the US.
As to the economy, the European Central Bank continues to pump money into the EU. As the following graph shows, year-over-year money growth continues to accelerate and at levels last reached during the recessions of 2008 and 1990:
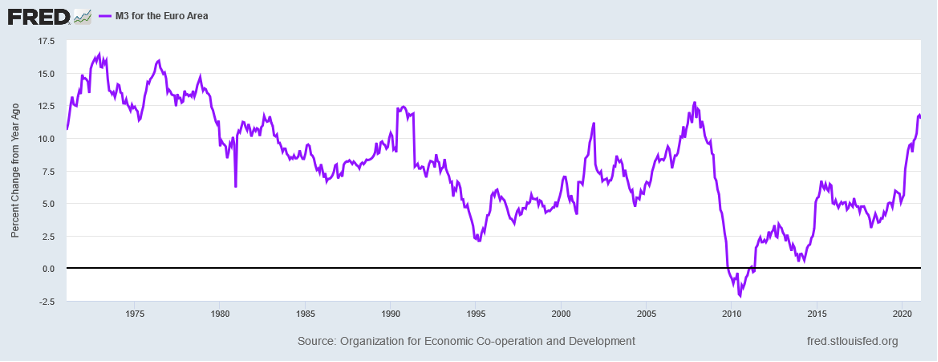
With the ECB providing a strong tailwind for the economy and major governments continuing to pump spending into the pie, the EU should see a massive recovery once the economy fully reopens. In fact, Industrial Production stands above pre-Pandemic levels even before the economies really recover:
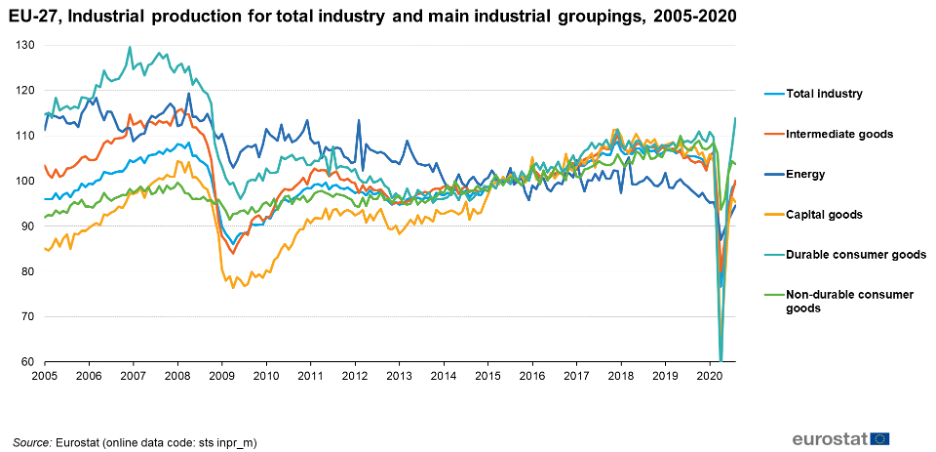
For Germany and Eastern Europe, the above chart signals economies that stand in good position to leap forward once full economic reopening occurs.
For those more dependent on services, such as Italy and Spain with their massive tourism industries, the 2020 Recovery Year will still leave their economies well below the level of 2019. For those wondering why the EU continues to move down the path of creating Euro-bonds and providing massive economic aid to these countries, the alternative path looks much less promising for the EU. For Germany, in particular, buying off these economies with aid will forestall their leaving the EU. In such an exit, Italy and Spain would massively depreciate their currencies, boosting both their economies at the expense of Germany, The Netherlands, Belgium, France, and Austria. Germany likely would take a massive hit to its exports as its manufacturers lose global competitive position, leaving its economy lagging behind for many years. For Spain and Italy, such a move would restore their economic growth to the levels prior to their EU entry and allow them to grow real incomes once more. Whether the aid ultimately stops their exit or not, remains to be decided. However, in the short term, with the EU Economy headed for recovery, Old Man Hopes will spring anew.
Begins A New Climb
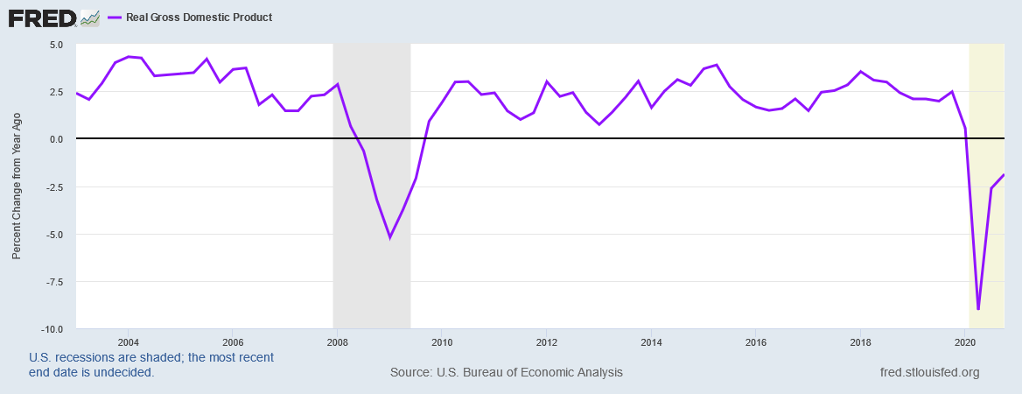
For the United States, despite the economy falling almost 3.5% in 2020 compared to 2019, Q4 2020 GDP stood less than 1.9% below the level of Q4 2019. With massive government support, a sharp recovery in GDP followed the Q1 fall, unlike in 2009:
With the economy continuing its rapid recovery, a move from traditional Early Cycle leaders of Housing and Autos towards Mid Cycle industries should unfold as the year progresses and these industries hand off the baton.
The Housing and Auto recoveries stand very mature from a cyclical perspective. For housing, a Federal Reserve driving interest rates downward to levels below those during the Great Depression greatly aided the industry. First, it created a spike in demand for existing and new homes in 2020 as housing became much more affordable. The following graphs clearly demonstrate this:
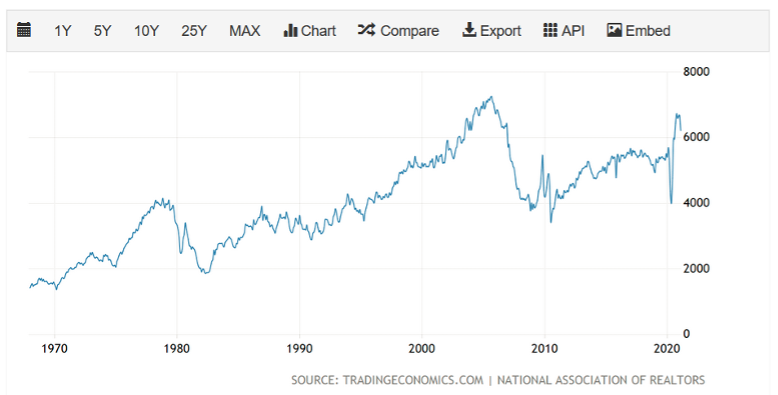
Graph courtesy of www.tradingeconomics.com.
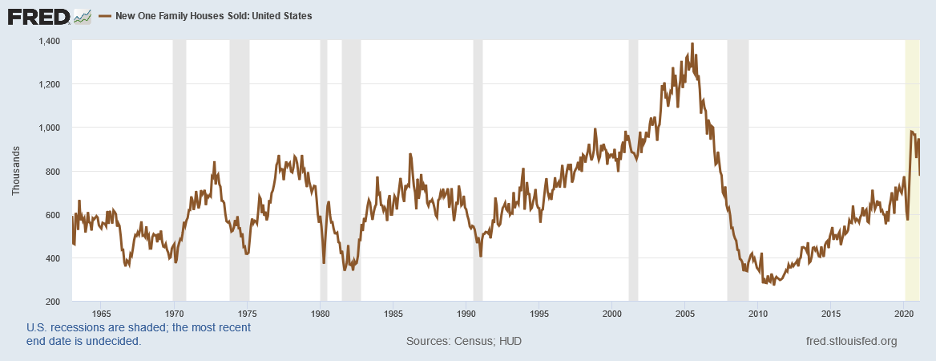
Second, New Single Family Home production exploded in response, as the following graphs of Starts and Permits shows:
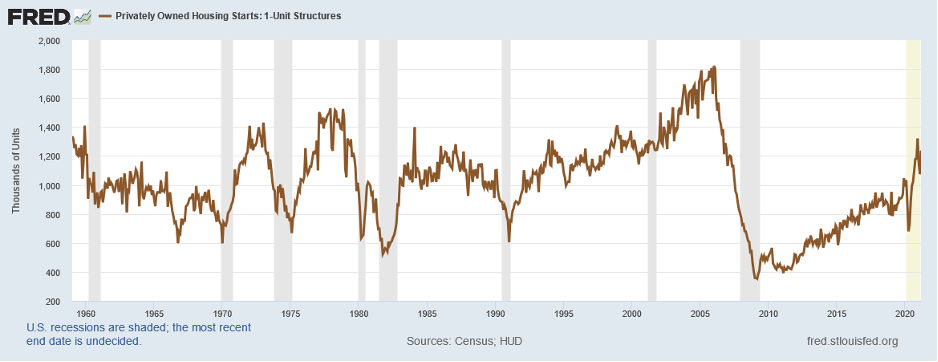
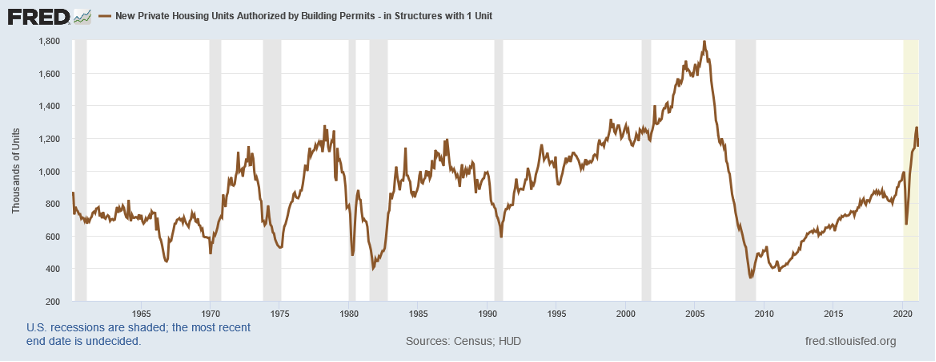
New Home Permits stood higher only during the Housing Bubble from 2003 – 2008. Third, in addition, to the supply of New Homes coming, there exists a large pool of foreclosures awaiting an end to the Foreclosure Moratorium, as 3.0+ million homeowners are behind on their mortgage payments. This group includes 2.1 million homes in “Forbearance”. These homeowners stand most at risk of Foreclosure once the Moratorium ends. Many possess monthly payments over a year behind with little hope of catching up. And should they have lost their jobs, the opportunity to restructure their loans will disappear. As such, if just half these non-performing loans end up foreclosed, this represents an additional year of Supply to the Housing marketplace. This should hit late Q1 2022, just as the lagged impact of rising rates slows down the Housing Market.
For Autos, the industry just experienced its sharpest recovery since the 1950s. Sales of Autos now equal their Pre-Pandemic levels:
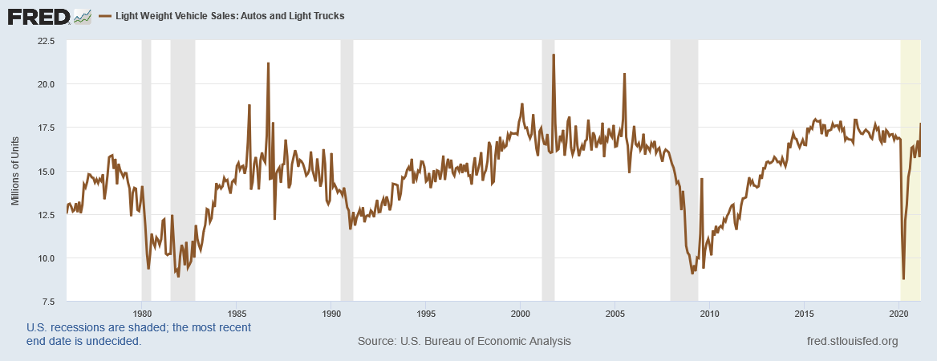
With Auto sales at these levels, a full recovery already exists in the industry.
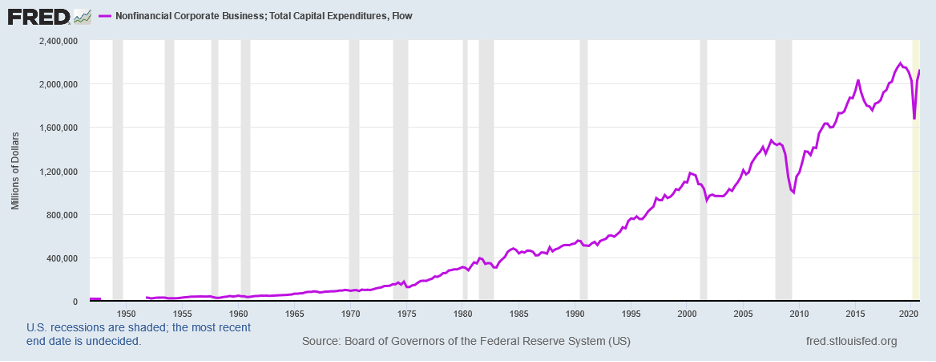
However, as the economy exits Early Cycle driven growth and enters Mid Cycle, new areas will thrive. These include those benefitting from Capital Spending and Infrastructure. Corporate Profits stand at record levels:
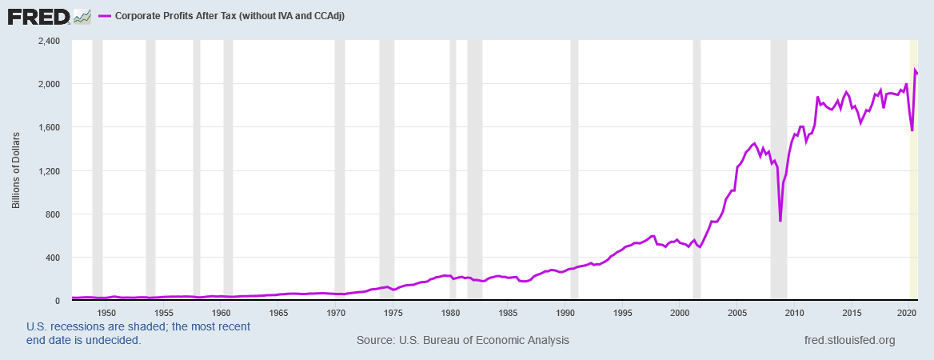
This record level includes the whole travel and leisure industry, representing 10% to 12% of GDP, that possesses significantly depressed profits or losses. As the reopening continues, these industries should disproportionately benefit, driving Corporate Profits to new heights. Corporate Profits typically lead Capital Spending by 6 months. Given the current record level of profits and the prospect of significant growth as these industries recover, Capital Spending should follow.
The last area to benefit is Infrastructure. This likely stands a H2 2022 or early 2023 event. Government Infrastructure Spending typically peaks in a Presidential Election Year. This should come as no surprise as the politicians in power attempt to boost their re-election prospects and point to actual accomplishments they can demonstrate to the voters. Unfortunately, relative to GDP, Gross Government Investment continues in a long-term downtrend as the following graph demonstrates:
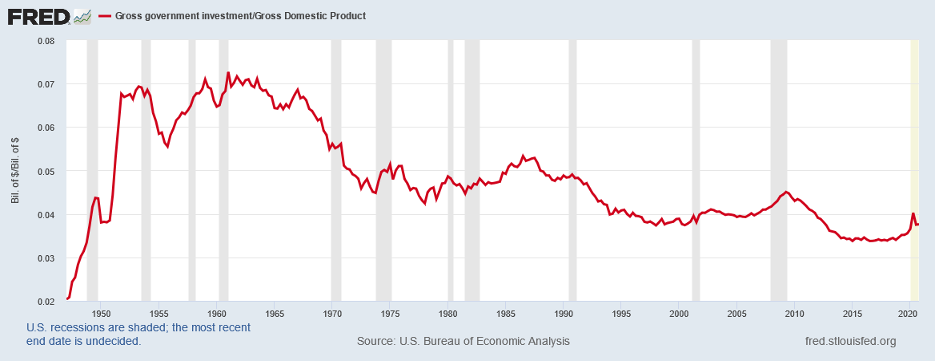
For the US, after the buildout of the Federal Highway System during the 1950s and 1960s, Government Investment to GDP ran 4.5% to 5.0% on average through the 1970s and 1980s. It then took a step downward under President Clinton, running between 3.8% and 4.0% during his Presidency and ending at 3.78% in Q4 2000. Once George Bush entered office, a slight improvement came, with capital spending recovering to the 4.0% – 4.1% level on average. Government Investment then took another step downward as President Obama focused his energies on the Affordable Care Act. Once the economy recovered from the Housing Crash, Government Investment averaged only 3.3% – 3.4%. President Trump reversed some of this fall, but Government Investment only rose back to 3.6% under his Presidency. For Americans wanting to understand the crumbling roads and bridges they must traverse, the chart above easily explains how the government did not invest enough in basic infrastructure. This stands in contrast to State and Local Government which remains more responsive to the will of the voters as they must answer in a way the Federal Government does not:
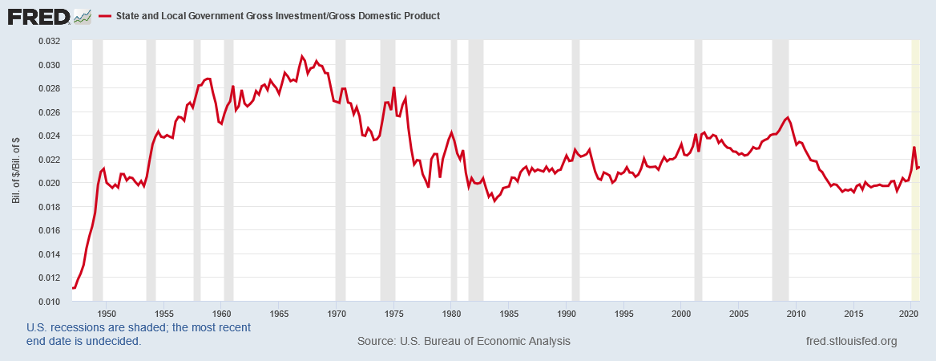
However, even with State and Local Government needing to respond more rapidly to the voters, Gross Investment to GDP fell significantly from 2008 to 2014, before stabilizing at close to levels last consistently seen in the country from 1950 to 1953. With President Biden focused on addressing this need, the United States might finally reverse this long term downtrend.
For the US, the country stands in the classic Early Cycle position. Housing and Autos led the recovery, as is normal. Corporate Capital Spending stands ready to take the baton in the relay race followed by Government Investment. And with Consumer Spending likely to grow over the next few years, end demand should support all this Investment. For the US, the path moves onward and upward after a brief interruption for the Pandemic. The next summit lies ahead and the country stands ready to make the assault. With the economy acting in a classic cycle and the banking system ready to lend, little stands in the way as the country Begins A New Climb.
Soy-anara, How Do You Spell Relief, and Saved By The Peak
Finally, we close with brief comments on Soy-anara, How Do You Spell Relief, and Saved By The Peak. First, according to the Buenos Aires Grain Stock, the La Nina impacted crops considerably down South with much dryer than expected weather. Both corn and soybean crops are suffering from Poor Soil Moisture. The soybean crop took a very hard hit with Poor/Very Poor Crop Conditions impacting 32% of the soybean crop compared to 8% a year ago. Given this, we say Soy-anara to the Argentine soybean crop. Second, with the Pandemic winding down, consumer behavior appears returning to normal. This means working through the massive stockpiling of Consumer Staples that occurred. For example, according to data from AC Nielson, toilet paper demand fell 4% in January compared to a year ago. Other products, such as Clorox wipes, which saw massive increases in demand likely face leaner times ahead as consumer’s right size their inventories. Given that many manufacturers added capacity and raised prices aggressively, declining demand and falling capacity utilization likely will put pressure on pricing throughout Consumer Staples. For consumers which endured these price increases over the past year, we see them saying How Do You Spell Relief, Reopening. And Third, office space demand crashed during the Pandemic. With the economy reopening, companies will once more request that workers be present, but maybe not all the time. Assuming consumers Work From Home (WFH) 2 Days Per Week, up from 0.7 Days prior to the Pandemic, then office demand would fall 28% compared to pre-Pandemic levels. However, with companies needing to have everyone in the office some days, a large part of this fall will get offset as companies size their space for Peak Demand. It is thought that potentially 17% to 20% of the 28% or between 60% and 75% of the drop in demand will be offset, leaving overall demand down just 8% to 11%. Given this, we see office building owners Saved By The Peak.
To go back to our Cover Letter click here
Confidential – Do not copy or distribute. The information herein is being provided in confidence and may not be reproduced or further disseminated without Green Drake Advisors, LLC’s express written permission. This document is for informational purposes only and does not constitute an offer to sell or solicitation of an offer to buy securities or investment services. The information presented above is presented in summary form and is therefore subject to numerous qualifications and further explanation. More complete information regarding the investment products and services described herein may be found in the firm’s Form ADV or by contacting Green Drake Advisors, LLC directly. The information contained in this document is the most recent available to Green Drake Advisors, LLC. However, all of the information herein is subject to change without notice. ©2020 by Green Drake Advisors, LLC. All Rights Reserved. This document is the property of Green Drake Advisors, LLC and may not be disclosed, distributed, or reproduced without the express written permission of Green Drake Advisors, LLC.