You Can’t Eat Relative Performance
When I began my career, back in the early 1980s, I was fortunate to work for some very successful investors who taught me how the real world worked. While I possessed an undergraduate degree in economics along with plenty of math, covering everything from US and International Economics to differential equations and statistics, it turned out that the academic theories were just that, theories. The real world required significant adaptation, forcing me to relearn everything with an eye to making money for investors. I would note that my favorite professor, who became my academic advisor, gave me some good insight as to the difference between Cornell and the real world. He would emphasize repeatedly that, despite all the wonderful courses I took, I still only qualified for paying work during the school year, as a waiter at a restaurant or bar. Or, I could tutor other students. That was it from his perspective. (I left out for him my forays into playing the card game Bridge for money, which turned out an attractive alternative method to earn my beer and date money. My math abilities aided me as I moved from $0.01 per point to $0.05 per point to $0.10 per point. And with a night of play sometimes delivering a win or loss exceeding 1,000 points, my winning more than losing became a source of “needed” cash. If we take inflation into account, then, according to the US Government’s CPI, this $100.00 would translate into almost $350.00 today. And if we use some alternative inflation statistics, that account for inflation using different weights and items than the CPI, then this number translates into anywhere from $400.00 – $500.00. However we cut it, it was real money back then.)
Just before I graduated, my uncle introduced me to a colleague who wanted to hire someone who knew statistics and computer programming and who was cheap. As a recent college graduate looking for his first job, I fit the bill. Anything that could get me into Wall Street would work. So, I took my first job trading commodities. Well, initially, I became chief cook and bottle washer. First, they taught me everything I needed to know about processing a trade and I spent the first few months of my new job helping the people in the back office. Then, they put me on the trading desk to assist one of the experienced traders. I learned all about handling two phones at once, one on each ear, and making sure to time stamp the trade tickets. Actually filling out the tickets and time stamping was critical as it proved when a trade was entered into the markets or filled. However, they still did not allow me to make any decisions or put trades into the market by myself. In the quiet periods, in between needing to help out the traders, they assigned me the task of automating their trade analysis and adding statistical factors into the system. When I got done, the program was not pretty, but it worked. If we input the various future prices into the system at the 3:00 pm close of the markets each day and how they related to the forward Treasury Yield Curve, it spit out which spreads, with their implied interest rates, looked attractive or were overpriced relative to Treasuries. After proving this out over several months, in real time with small positions to validate the statistical analysis, they allowed me to actually put the trades into the marketplace based on this system. The Partners emphasized that everything was about making money. And that if I did not perform, well, you can imagine. Fortunately, my system and the analysis it performed worked on a consistent basis, allowing me to remain employed and pay the rent. (And, most importantly for my 22 year old self, this also covered my nights out.) With success, came more capital, sometimes exceeding that of the more experienced traders. Ultimately, my book of commodity arbitrage trades, where we looked to make 20 to 40 basis points (0.2% to 0.4%), continued to grow reaching over $1 billion in gross value in less than a year.
As part of the trades, we needed to hedge downside risk. As my boss explained, the clients expected us to make money at all times. Losing money, even if we lost significantly less than the drop in gold or silver prices, was not acceptable. As a 23 year old, I pointed out that hedging cost us part of our profits. As the owner of the firm, my boss pointed out that not hedging, in a severe market drop, could cost us our clients and the business. If we lost money, even if much less than the commodity markets, we would lose the clients to alternatives such as bonds with yields of 9% or more. We were in the Money Making business not the Relative Return business, as he reminded me constantly. (Today, this is known and marketed as “Absolute Returns”.) Or, as he more indelicately phrased it, “You Can’t Eat Relative Performance”. So, I hedged as instructed, especially as I liked earning a paycheck, which turned out the correct move, as there were some significant drops as well as moves upward.
This brings us to the present day Stock Market. Some argue that various sectors of the market remain inexpensive on a relative basis. For example, Small Cap Stocks went from the 12th Percentile of valuation relative to Large Cap Stocks in October to the 58th Percentile today. So, Small Cap Stocks could still outperform Large Cap Stocks as they tend to be economically sensitive and do very well early in an economic cycle. And Small Cap Value stands only in the 12thPercentile Relative to Small Cap Growth, up from just the 2nd Percentile in September. And given that these stocks stand the most economically sensitive of Small Caps, they should disproportionately benefit from the economic recovery. Given the statistics, there exists little argument that these stocks stand attractive on a Relative Valuation basis. However, Absolute Valuation for Small Cap Stocks stand in the 100th Percentile historically, up from the 32nd Percentile in March 2020. And overall Absolute Valuations for the Stock Market remain sky high, as the following updated CAPE Chart demonstrates for the S&P 500:
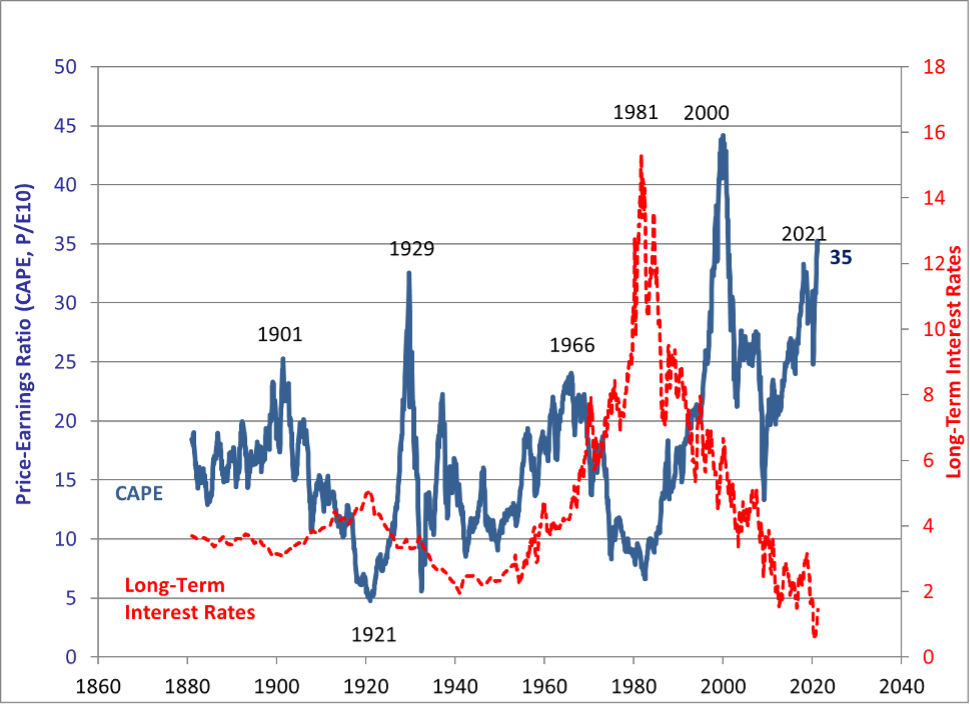
Chart Courtesy of Robert Shiller, Yale University. http://www.econ.yale.edu/~shiller/data.htm
The current reading of 35.0 stands above the peak reading in 1929 of 32.6. Only during the height of the Tech Bubble, from November 1998 until February 2001, did readings exceed this level over the past 140 years. While readings such as these do not indicate an imminent Bear Market, they do indicate poor market returns over the next decade despite any strong short term returns that investors might enjoy.
Furthermore, the market stands in the 12th Year of a long term Secular Bull Market. The following chart indicates the distance the market has travelled:
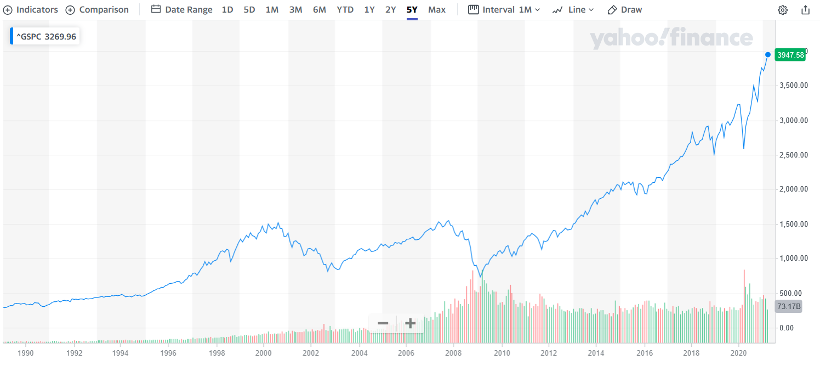
Chart Courtesy of Yahoo Finance. www.finance.yahoo.com
While the chart makes it difficult to understand the strength from 1988 to 2000 and how it compares to 2009 to 2021, the following statistics make clear the similar distance travelled over the relevant time frames:
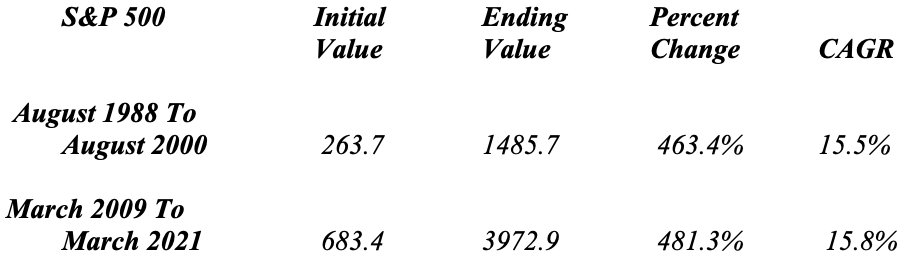
Data from Robert Shiller and Yahoo Finance using close as of March 31, 2021.
Other data confirm this position of the market. For example, Large Cap IPOs stand at their highest level since 1999 – 2000 while Small Cap IPOs now exceed their 1997 Peak. And if one were to look at the Top 1000 Stocks in the Equity Markets, a very interesting phenomenon stands clear. Stocks with P/Es of 50x or more plus Loss Making Companies comprise a disproportionate share of those likely to decline, similar to the 1999 – 2000 period:
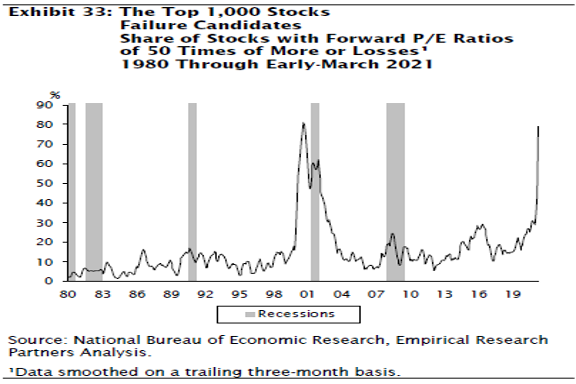
Chart courtesy of Empirical Research, www.empirical-research.com
And given that Growth Stocks make up the largest share of the Equity Markets since 1999 – 2000, such statistics should give investors pause.
While Value Stocks and Small Cap Stocks should still outperform Growth Stocks and Large Cap Stocks, respectively, given their Relative Valuations coupled with the early stage of the economic cycle and the Federal Reserve’s expansive monetary policy, there exists an unfortunate truth about major turns in Relative Performance by Style. According to Stifel Nicolaus, typically, this occurs during pullbacks in the Equity Markets. Should this “typical” sequence of events play out, investors would enjoy, what my first boss would call Relative Return, whereby owners of these stocks would lose less in a market pullback. And with the CAPE Ratio flashing Red and highly valued Growth Stocks dominating Failure Candidates, this sequence of events, while impossible to predict when it will occur exactly, becomes more and more likely. And given the long term Commodity Cycle bottoming, which will reinforce a turn to Value, investors could be looking at a repeat of the second half of the 1960s and early 1970s. Given all this, I can hear my first boss’s words, that were hammered into my head, echoing loudly, “You Can’t Eat Relative Performance”.
Vacation Anyone? Anywhere?
With Americans getting vaccinated at a rapid rate, the question seems: where are you going? But the true question might be: Where can you go? Given that many countries remain well behind the pace of vaccinations in the US, they have yet to reopen their borders. For example, those trying to visit Toronto, just a stone’s throw from the US border, will face a mandatory quarantine, vaccine or no vaccine. And with Europe well behind the US, borders remain closed to US travelers. For those looking to travel this summer, the question still remains: Vacation Anyone? Anywhere?
To SLR or Not? Fedspeak, Alphabet Soup, & Shadow Tightening
For those of us wondering how the Federal Reserve will begin to tighten policy without showing their hand, a journey into Fedspeak seems appropriate. In this particular instance, the Fed created something called the SLR Exemption, part of the Alphabet Soup of acronyms. SLR stands for Supplementary Leverage Ratio. To help banks during the Pandemic, the Fed allowed them to exclude from the calculations of their regulatory capital the need to hold capital for balances held at the Federal Reserve. This encouraged banks to hold significant liquidity during the crisis and it allowed them to show a higher capital ratio than they otherwise would. Well, all good things come to an end. The Federal Reserve made the following statement on March 19, 2021, “The federal bank regulatory agencies today announced that the temporary change to the supplementary leverage ratio, or SLR, for depository institutions issued on May 15, 2020, will expire as scheduled on March 31, 2021. The temporary change was made to provide flexibility for depository institutions to provide credit to households and businesses in light of the COVID-19 event.” In other words, the Fed tightened capital requirements by eliminating the exemption. And, given the massive spending by Congress, expect similar moves down the line as the Fed moves to reign in the Alphabet Soup of policies it created to fight the Pandemic and to create Shadow Tightening.
Upcoming Speaking Events
Our “live” Public Speaking continues to accelerate in 2021 as groups have adjusted to the Zoom and Skype dominated world. Recent appearances include several private investor groups and associations. Upcoming appearances include a number of C Level Executive groups, industry associations, and investor groups. Having received our first shot and scheduled to receive our second shot on April 12, we looked forward to appearing live at the United States National Strategy Seminar in June in Carlisle, PA. Unfortunately, despite vaccinations accelerating, the event will now occur via Zoom and not live. However, we look forward to the fall and getting up in front of a large audience once more. As to speaking for your group, either Zoom or live, please feel free to contact us. We would be happy to accommodate your needs.
Monthly Letter Preview
This Month, we provide our Global Economic Quarterly, Parts II and III with an eye on what lies ahead for the Global Economy:
- Global Economic Quarterly, Part II: A New Path Ahead – In a continuation of Part I from last month, we provide an analysis of the current global conditions and the key factors that will impact the coming economic cycle. With the US recognizing the threat from China, US economic policy moved to accelerate US growth and to create higher levels of investment into the economy. In many ways, the U.S. continues to embrace the policies utilized by Emerging Economies over the past 20 years to supercharge their growth. Should the U.S. continue down this path, it creates major implications for how the Global Economy will grow and for the relative growth of Developed Economies compared to Emerging Markets.
- Global Economic Quarterly, Part III: Scenes from Abroad – We provide a snapshot of the current conditions in the major economies and regions of the world and their economic prospects for 2021 and 2022
As always, we end the Monthly Letter with Economic Observations on the US Economy through Interesting Data Points that provide color on the happenings in America. The link to the Monthly Letter is:
https://greendrakeadvisors.com/views-from-the-stream-april-2021/
Should you have any questions on how the above issues or the items discussed in our accompanying Monthly Views From the Stream Letter impact your family’s financial position or your business’s future as well as the potential actions you could take in response, please do not hesitate to contact us. We welcome the opportunity to discuss this with you.
Yours Truly,
Paul L. Sloate
Chief Executive Officer