Global Economic Quarterly: The Reopening Force & The Fight For Global Growth

“But we cannot foresee the future perfectly. The unexpected may happen; and the existing tendencies may be modified before they have had time to accomplish what appears now to be their full and complete work. The fact that the general conditions of life are not stationary is the source of many of the difficulties that are met with in applying economic doctrines to practical problems.”
Equilibrium of Normal Demand and Supply
Book V, Chapter III, Section 5
Principles of Economics, 8th Edition
By Sir Alfred Marshall, 1890
The Reopening Force
The Global Economy continues on the path to strong 2021 economic growth, with the US and European economies headed towards full reopening. While the healthcare establishment will continue to push for its vision of how to manage the economy, in light of a Pandemic, focusing on evolving strains of the Coronavirus to justify its newfound influence, economic and political forces continue to gather that will swamp this effort. These forces, led by the vaccination effort combined with the power of the majority in a democracy, will easily justify reopening the economy and enabling the populace to resume its daily life. And while imposing controls on people in a public emergency can occur, once that emergency wanes, continued use of emergency powers runs into the wrath of the voters in a democracy.
When this Reopening Force combines with massive pent-up savings, the desire for normality, and huge government stimulus, the outcome leaves little doubt. To date, governments around the globe have injected $30 trillion of stimulus. This comes before the latest $1.9 trillion in the United States and €750 billion in Europe (~$900 billion). China will run a budget deficit of over 10% of GDP this year, again. And other countries, such as Indonesia and Malaysia, will run deficits anywhere from 4% to 8%. Even the UK expects to run a 10.3% of GDP budget deficit for the 2021/2022 Year. With this much government stimulus piled on top of the spending of consumers, GDP growth should head towards its best result in over two decades. And while there exists no free lunch in life, the party will go strong in 2021 with the hangover pushed to 2022 or later.
While Government spending across the globe stands clear, due to the headlines it gathers, the potential impact of increased Consumer spending stands in the shadows. A little sunlight will make clear the coming tidal wave in the US, which one can extrapolate around the world. For the US, the following chart makes clear what will come:
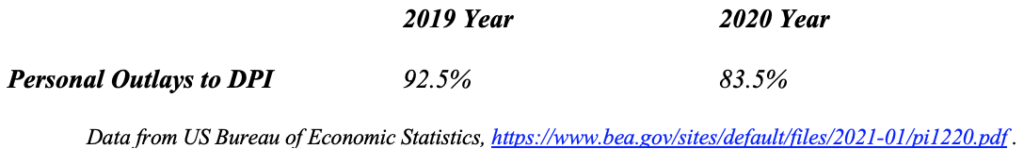
The 9% of Personal Disposable Income represents ~$1.6 trillion. With US GDP $20.9 trillion in 2020, this equates to 7.5% of GDP in underspending in Calendar 2020. As the economy reopens, not only will Consumer Spending move back towards this 92.5% level, but a portion of forced Savings in 2020 will become unleashed. How this will become unleashed becomes obvious in the following chart:
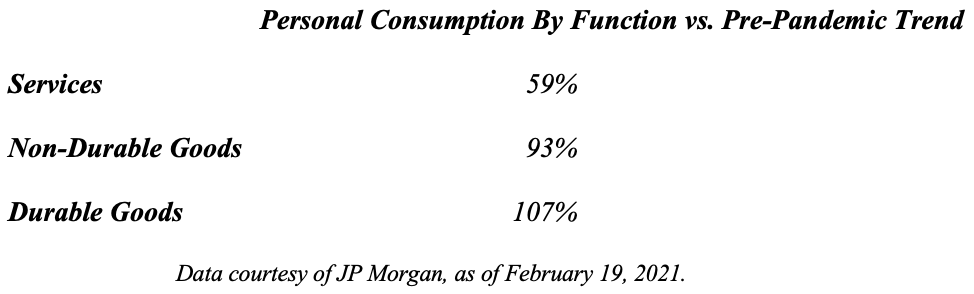
For long suffering airlines, hotels, restaurants, cruise lines, amusement parks, barber shops, parks, museums, movie theaters, spas, religious institutions, office buildings, retailers, and other public gathering places coupled with their suppliers, reopening cannot come soon enough. And while the data above capture the United States, the EU recently moved to enable tourism for countries such as Spain and Italy who cannot afford to miss another season by floating the concept of vaccination certificates which would allow these countries to reopen their industries to the rest of the EU and to the Globe.
The Fight For Global Growth
Overlaying this reopening driven recovery hovers, like a spectre, The Fight For Global Growth. With the Global Economy reopening, countries continue to jockey for position to reap the largest rewards for their countries and citizens. Everyone wants the biggest piece of the pie they can get. And with the US now adopting many of the policies that Emerging Economies followed over the past 30 years, the global game changed dramatically. With the economic and global strategic rivalry with China heating up, the US must adapt its economic policies to accelerate economic growth, to leverage its massive R&D investment, to rebuild its manufacturing base, to shorten global supply lines, to accelerate new technology adoption, and to dominate the frontier of space. All unattainable with the economic policies of the past 30 years, but attainable with a reorientation towards a Cold War Strategy, controlling technology exports and aligning with other countries to counter China, coupled with a reordering of international trade, into a system that resembles the GATT. With just the limited actions to date, early indications for 2021 show the U.S. capturing a larger share of Global Growth than China for the first time in over 20 years.
At the core of Emerging Market economic policy success stands currency devaluation. The devaluations enabled these countries to ensure global competitive advantage for their manufacturing industries and to prevent the rise in labor rates from making their light industry uncompetitive with other Emerging Economies. To understand how much these devaluations supercharged growth, the recent case of Zambia provides a clear example. The Zambian Kwacha fell 33% in value in 2020. As a result, exports grew 92% in nominal terms and 29.5% in real terms year over year by November, as the devaluation played out in the real economy. At the same time, imports fell 26.5% in real terms. As a result, Zambia’s trade surplus soared to 13% of GDP in 2020 from a deficit of 0.9% in 2019. Even with a drag from the rest of the economy, the devaluation supercharged Zambia’s growth. And it improved their competitive position vis-à-vis other Emerging Market (EM) Economies with more stable currencies. The following chart demonstrates the massive economic benefits a country can reap by undervaluing its currency, as the explosion in Vietnam’s trade surplus with the United States demonstrates:
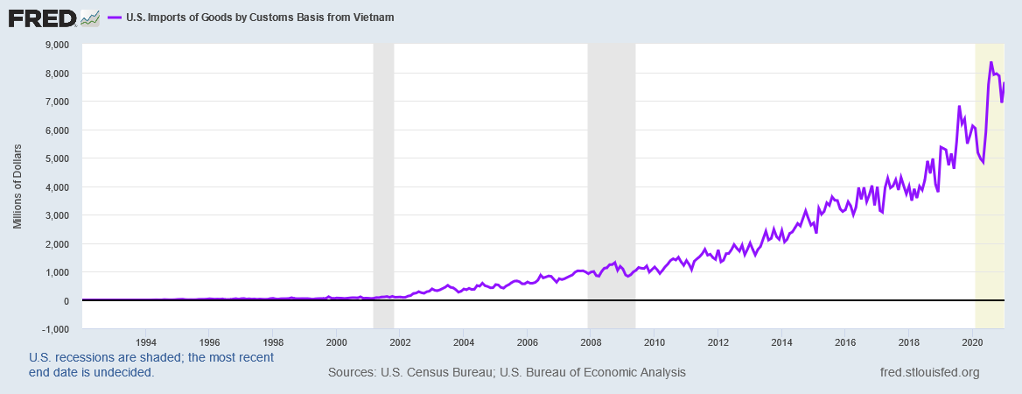
Classic economic theory would indicate that if a country’s Balance of Trade rose dramatically, it would also drive that country’s currency upward. But that is not what occurred from 2007 to 2020, when the Vietnamese currency depreciated against the US Dollar despite its trade surplus increasing 8x over that time frame. This depreciation ensured Vietnam’s currency did not rise in real terms despite the inflation in its economy. Thus, this policy ensured continued economic growth at a rapid rate. With “Emerging” Markets now representing well over half of Global GDP, allowing such policies to continue becomes difficult as it asks Developed Economies to sacrifice their growth for continued rapid Emerging Market growth.
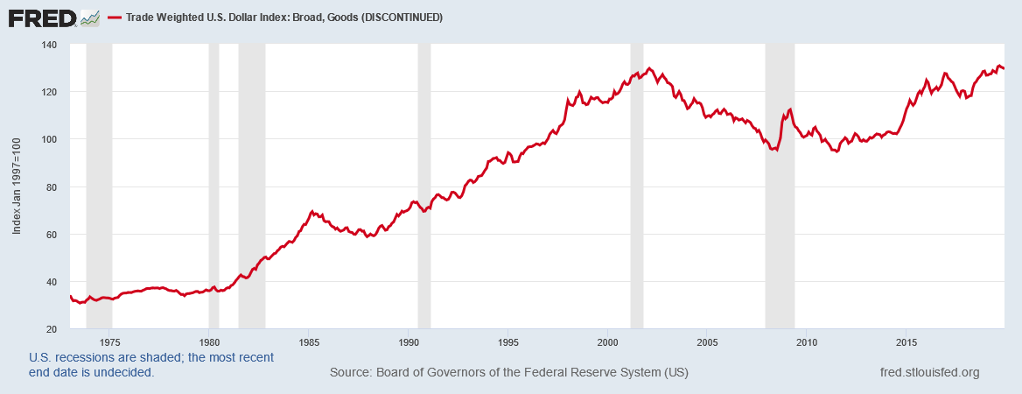
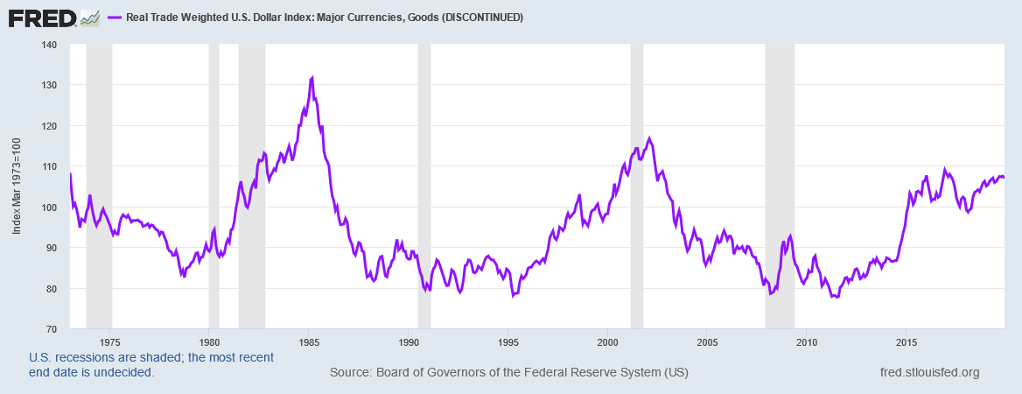
To view this in a broader context, understanding the change in the value of the US Dollar over the past 50 years provides perspective. The following chart shows the value of the Trade Weighted US Dollar from 1973 – 2019 and demonstrates that it traded in a range since 2000:
Unfortunately, appearances can be deceiving. If we break the currency moves down into Developed Markets (DM) Economies and EM Economies, a different story emerges. The first chart shows the US Dollar against DM Currencies from 1973 to 2019 and the second shows the US Dollar against EM Currencies over the same time frame:
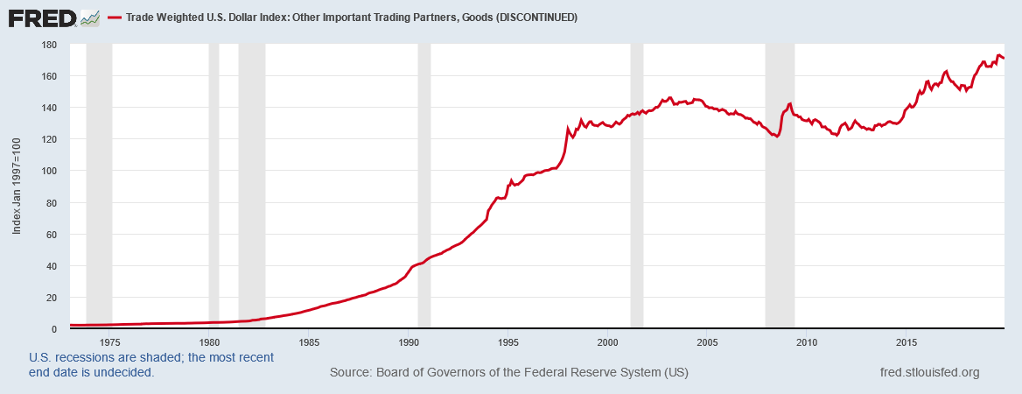
As the two charts illustrate, there exists a dramatically different story in comparing the DM vs. EM. Against the DM Economies, the US Dollar stands slightly above its long term range. And if we look at recent performance that includes 2020 and 2021, as the following chart does, a similar story ensues:
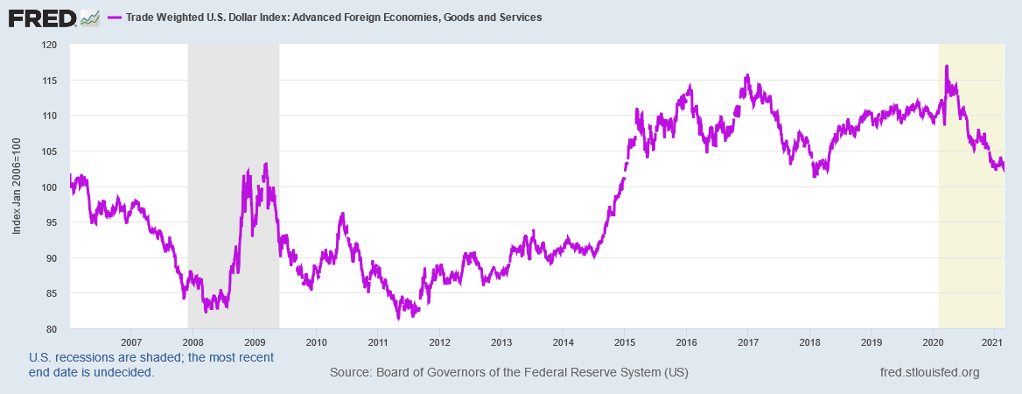
The US Dollar stands only 2% above where it did in 1973 against these currencies and only 2% above where it did in 2006. However, as the chart preceding this illustrates, the performance against EM Currencies differs markedly. And even if we look at recent performance, it differs as well:
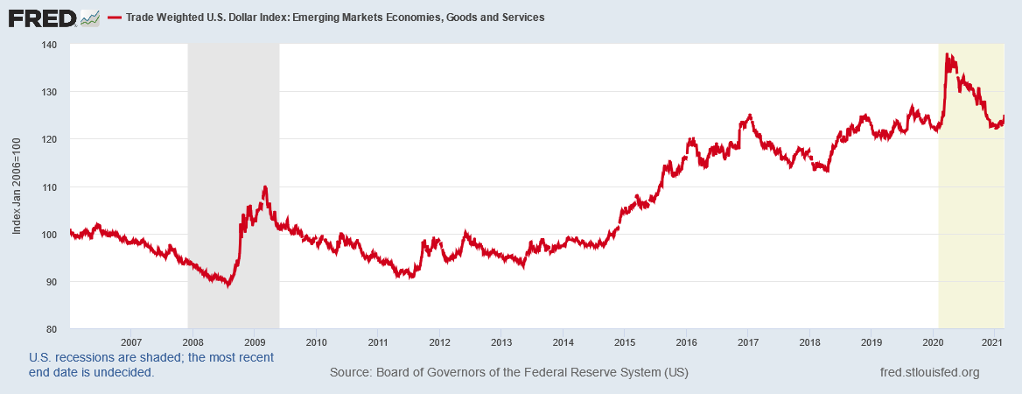
The US Dollar stands 20x the value it did in 1973 against EM Currencies. And even if this analysis only examines the period from 2006 to 2021, the US Dollar stands almost 25% above its level at that time.
If the US needs to rebuild its manufacturing, such a state of affairs cannot continue. Thus, currency devaluations must meet policies that effectively undo any attempted devaluation or put the brakes on the economic benefits reaped by doing so. If one looks carefully at the EM Currency Chart that includes 2020 and 2021, the chart clearly shows an attempted EM devaluation in 2020 that quickly came undone. This stands in stark contrast to the 2008 EM devaluation that took almost 3 years to reverse. The reason for this difference originates in the actions of the Federal Reserve. The easiest way to view this comes from looking at a chart of M2. M2 basically represents cash and liquid assets and stands a proxy for money expansion by the Central Bank. The following chart shows M2 since 1959:
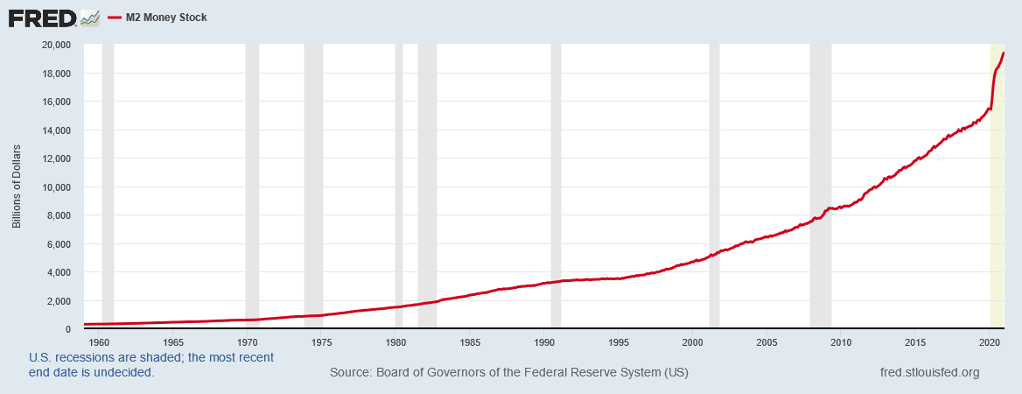
Looking closely at the chart shows M2 Growth slowed dramatically in 2009 – 2012. However, in 2020, M2 Growth exploded upward. The following chart illustrating the year over year changes in M2 Growth makes this clear:
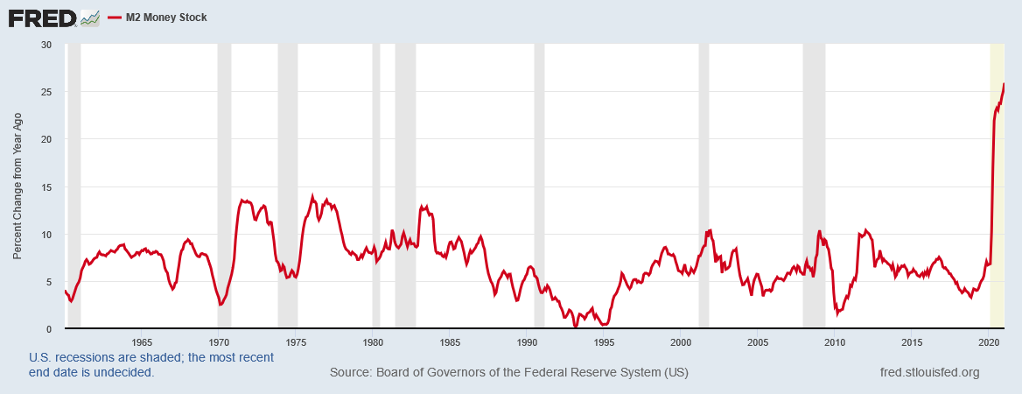
Simply put, in order to forestall devaluation by the Emerging Markets, the United States entered into massive money printing, care of the Federal Reserve. In other words, the US let the EM know that if they attempted to devalue against the US, the US would print sufficient currency to undo such a state of affairs in rapid order. And with the US starting from a much lower inflation starting point, EM Economies would face high inflation that could cause social unrest should they pursue such policies.
Unfortunately, for areas like the European Union (EU) that profess to want to keep inflation low, it puts them between a rock and a proverbial hard place. If the EU follows such a policy, the Euro will appreciate against the Rest of the World. With European growth already under stress, such additional economic headwinds likely could stretch the EU to the breaking point. In addition, with the US moving to create a domestic production base for key technologies, the EU’s ability to export high value manufacturing goods to the US will come under pressure. The following chart shows EU M2 Growth since 1980:
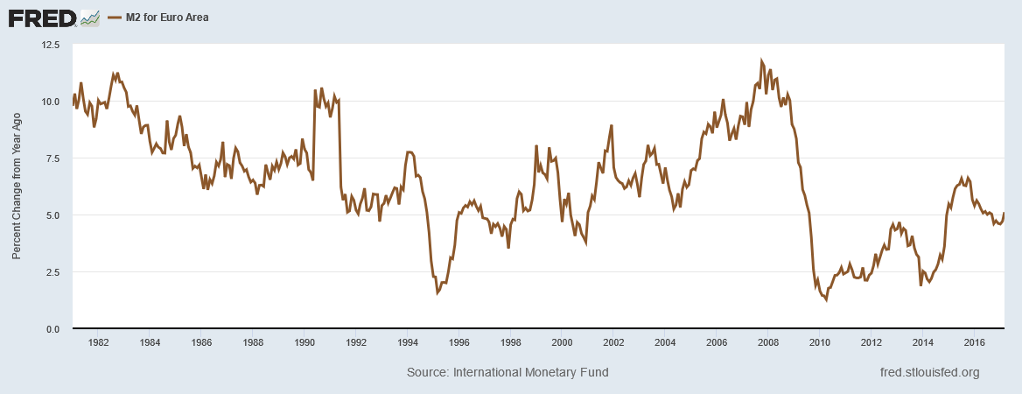
While Mario Draghi was able to push M2 Money Growth to 5% on average during his time as ECB President from 2011 – 2019, with the US growing M2 at 25% recently, keeping the Euro down will become an issue. Thus, current ECB President, Madame Christine Lagarde, recently made comments about controlling interest rates via some form of Yield Curve Control. This was an attempt to short circuit the recent runup in the Euro against the US Dollar. While jawboning may work in the short term, economic fundamentals tend to sweep aside platitudes not followed by action.
Lastly, with the U.S. viewing China as a global strategic rival, supply chains, manufacturing capabilities, and technology become national priorities. From 2000 – 2015, the U.S. allowed critical supply chains to move to Asia for key areas, such as semiconductors, high end manufacturing, and telecommunications. However, starting in 2015, even prior to the Trump Administration, the U.S. began to reexamine this posture. And since then, the U.S. began to focus on relocating key supply chains back to the U.S., putting them under domestic control, or at least to Canada and Mexico, creating short, defensible logistics for supply lines. Recent examples of U.S. intervention include creating a domestic EV Battery supply chain, for example, encouraging firms such as GM and LG to build an EV Battery factory in the U. S. for $2.3 billion with a second to follow, and appropriating monies for advanced semiconductor fabs to be built in the U.S., such as Taiwan Semiconductor building an advanced manufacturing plant in Arizona. In addition, the U.S. underwrote a number of critical portions of the supply chain, such as creating a rare earth mining and processing infrastructure in the U.S., and protected a number of other industries from foreign imports via tarifss, such as the steel industry, leading these industries to expand domestic capacity.
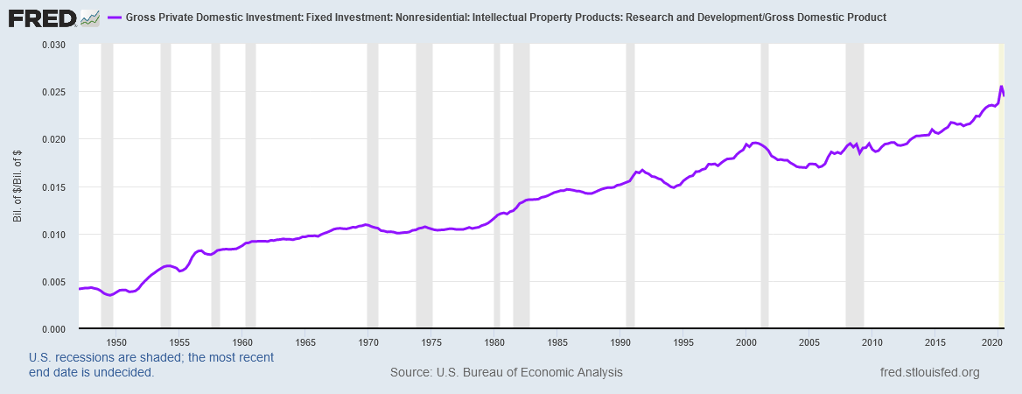
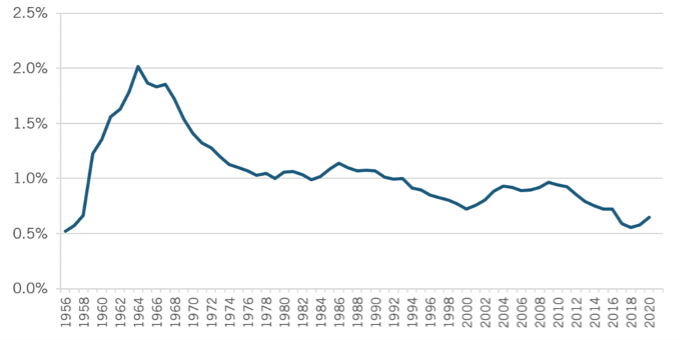
However, the most significant change lies in the potential to limit technology exports. America did this with much success during the Cold War with Russia, funding new industries and ensuring these technologies remained on American shores. Not only did it protect U.S. intellectual capital, but it drove domestic Investment. The U.S. remains a global R&D (Research & Development) powerhouse. R&D to GDP remains in an almost 70 year upturn:
And the U.S remains one of the top 2 countries spending money on R&D. This is despite the Federal Government’s R&D remaining stagnant in nominal terms and shrinking in real terms relative to GDP:
The rise of China as a rival R&D powerhouse, driven by government funded research, put this lack of federal focus on funding R&D back in the spotlight. According to the American Academy of Arts & Sciences, Chinese R&D spending will surpass the U.S. in the near term:
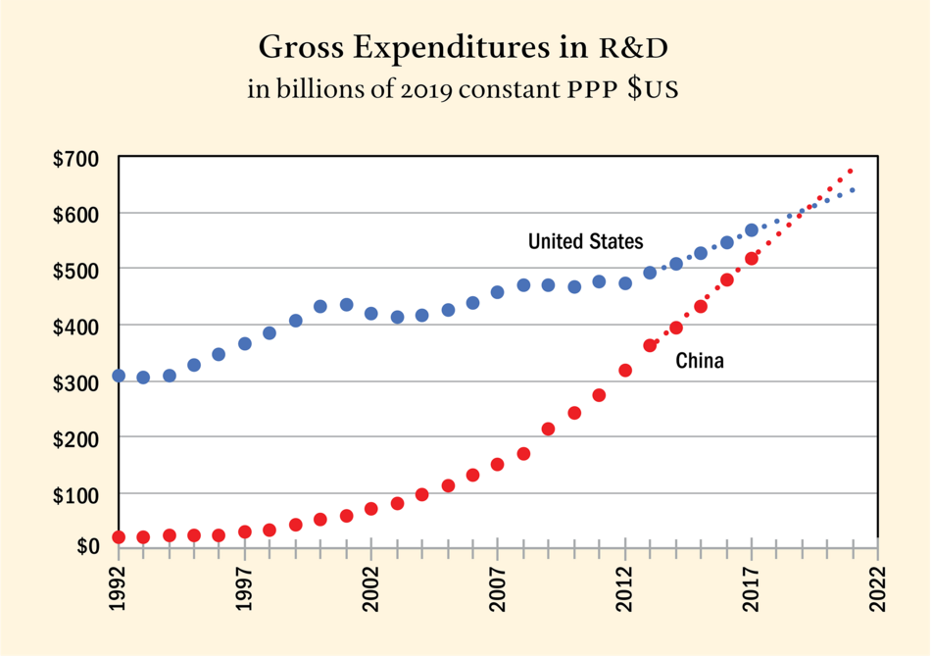
Chart courtesy of American Academy of Arts & Sciences report: The Perils of Complacency Available at: https://www.amacad.org/sites/default/files/publication/resources/Perils-of-Complacency_Full-Report_3.pdf
Confirming its objectives of attempting to dominate Global R&D, the Chinese Government announced plans at its annual policy meeting in March, 2021 to increase R&D spending by 7% in 2021 on top of a 7%+ increase in 2020.
For America, putting in place the policies it used so successfully during the Cold War appears underway. First, the United States beefed up its technology export controls. This came through a significant increase in the jurisdiction of CFIUS, the Council on Foreign Investment in the U.S., through Congressional legislation. With dollars following legislation, CFIUS hired numerous people, including former investment bankers, venture capitalists, and private equity investors, expanding dramatically its capabilities and reach. With this expansion, CFIUS now examines almost every transaction involving a foreign investment in a U.S. company or facility, whether direct or indirect, or plans to export technology to a R&D Center overseas or for a production facility outside of domestic borders. As a result, several high profile transactions have been nixed and more appear headed for the scrap pile. In addition, CFIUS now possesses authority to block joint ventures with foreign entities if U.S. technology stands a part of the proposed J.V. Lastly, the Commerce Department issued a rule titled, “Securing the Information and Communications Technology and Services Supply Chain”. (See: https://www.federalregister.gov/documents/2021/01/19/2021-01234/securing-the-information-and-communications-technology-and-services-supply-chain .) This allows the Commerce Department to block, unwind, and condition transactions in these areas. This stands on top of the power of CFIUS to intervene in critical industries. This rule applies to “foreign adversaries”, with specific focus on China and Russia, although it can apply broadly to a wide swath of regimes the U.S. considers rivals across the globe. And, given the need to rebuild U.S. manufacturing with cutting edge technologies and manufacturing capabilities, technologies such as 3D Manufacturing, Robotics, Advanced Process Controls, Material Science, Biotech, and other critical 21st Century technologies will find themselves subject to government review, limiting the ability of corporations to develop technology in the U.S, only to build the plant utilizing or manufacturing the technology overseas due to foreign government incentives. With just a small move in this direction, U.S. Manufacturing Investment to GDP already appears to have bottomed, on a long term basis, and turned upward:
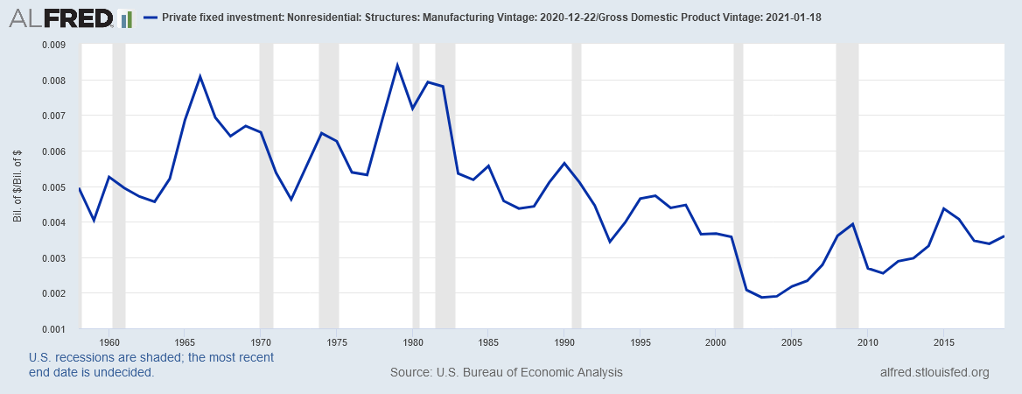
With Congress now appropriating monies to subsidize plants in the U.S., to match actions of Emerging Markets, and the U.S. potentially clearing some of the red tape, to allow investment to move ahead faster, the probability that this metric continues to rise at a rapid rate seems likely, especially as the U.S. relocates technology manufacturing back to the U.S., creates critical industries needed to support the national defense, provides economic incentives for green technologies, prevents the export of technology developed domestically, and forces companies to manufacture products on U.S. soil once more. With these policies in place, it becomes easy to envision the U.S. Recapturing Global Growth from “Emerging” Market Economies, reordering the global growth paradigm, and enabling the U.S. to keep up with China’s state sponsored growth focus.
The Global Economy stands poised on the cusp of massive growth, not seen since the 1990s. The Reopening Force will drive all economies forward in 2021 from Asia to Europe to Africa to the Americas. However, beneath the surface, significant changes continue to take place as the rivalry between China and the US heats up in a New Cold War. Layered on top of this, The Fight for Global Growth will reorder the Global Economy as the U.S. and other Developed Markets address the Currency Wars waged by “Emerging” Market Economies over the past 30 years. This will occur as governments move to prevent their currencies from appreciating and move to force Investment back to their domestic economies. And with currencies remaining competitive, national security driving supply chain decisions, tariffs protecting domestic industry, and economic incentives to encourage investment and development, Recapturing Global Growth should result for the U.S. and other Developed Economies as they move to counter China in a New Cold War.
To go back to our Cover Letter click here
Confidential – Do not copy or distribute. The information herein is being provided in confidence and may not be reproduced or further disseminated without Green Drake Advisors, LLC’s express written permission. This document is for informational purposes only and does not constitute an offer to sell or solicitation of an offer to buy securities or investment services. The information presented above is presented in summary form and is therefore subject to numerous qualifications and further explanation. More complete information regarding the investment products and services described herein may be found in the firm’s Form ADV or by contacting Green Drake Advisors, LLC directly. The information contained in this document is the most recent available to Green Drake Advisors, LLC. However, all of the information herein is subject to change without notice. ©2021 by Green Drake Advisors, LLC. All Rights Reserved. This document is the property of Green Drake Advisors, LLC and may not be disclosed, distributed, or reproduced without the express written permission of Green Drake Advisors, LLC.