The Consumer: Back to Normal But With a Split Personality

Views From the Stream
The Monthly Letter covers two topics this month. First, we provide a look at the Consumer. After exiting the Pandemic, the Consumer went on a spending spree to make up for lost time or, what might be better phrased, forced confinement. After catching up on spending and utilizing the Federal Government’s largess, the Consumer appears to have settled down to a more sedate pace that is consistent with earnings. However, under the surface, trouble is brewing, as the split in outcomes for those in the bottom half compared to the top 20% continues to widen. Second, as always, we close with brief comments of interest to our readers on a variety of current topics relevant to the economy and the markets.
The Consumer: Back to Normal But With a Split Personality
“The report of my death was an exaggeration.”
Mark Twain, 1897
For the United States, the “Consumer” stands the great arbiter. With Consumer Spending comprising over 65% of US GDP, swings in spending create outsize impacts on the economy. And while Recessions create turbulence here, historically, spending tends to remain at a relatively constant rate relative to incomes. While some may say the Consumer went on a debt spree to drive spending in addition to the income growth, the statistics do not support this contention. It actually stands the Federal Government that went on a spending spree backed by debt. Despite Consumer debt remaining reasonable, the cost of this debt is unevenly spread across the economy. Thus, those in the upper half of the income distribution possess low cost mortgages and car loans, that provide them low interest costs to income. In contrast, those in the bottom half possess high cost debt via credit cards and other lenders, such as payday lenders, charging rates of 20% to 30%+ that the Government used to categorize as usury. This split between the haves and have-nots explains much of the contradictory data that exists concerning the Consumer and the economy.
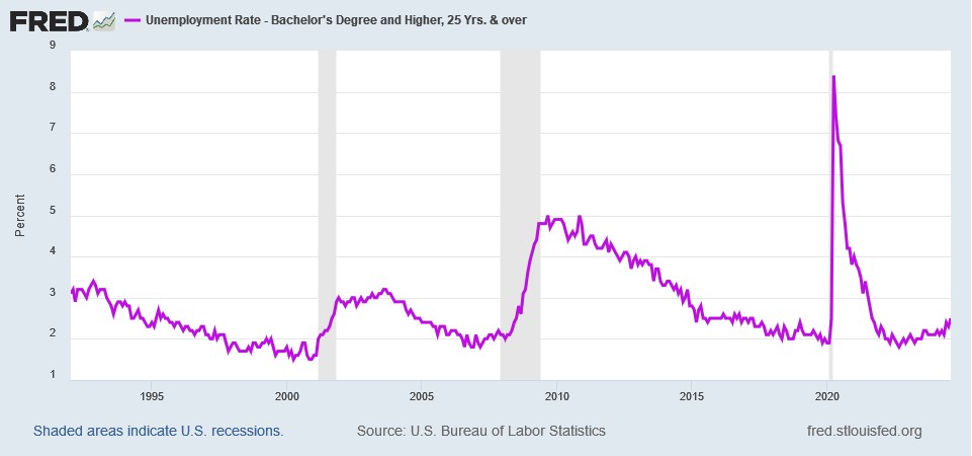
To better understand this dynamic, a quick look at employment will make clear the dichotomy above. For those in the upper half of the income distribution, represented by those with a Bachelor’s Degree or more, Unemployment stands at low levels:
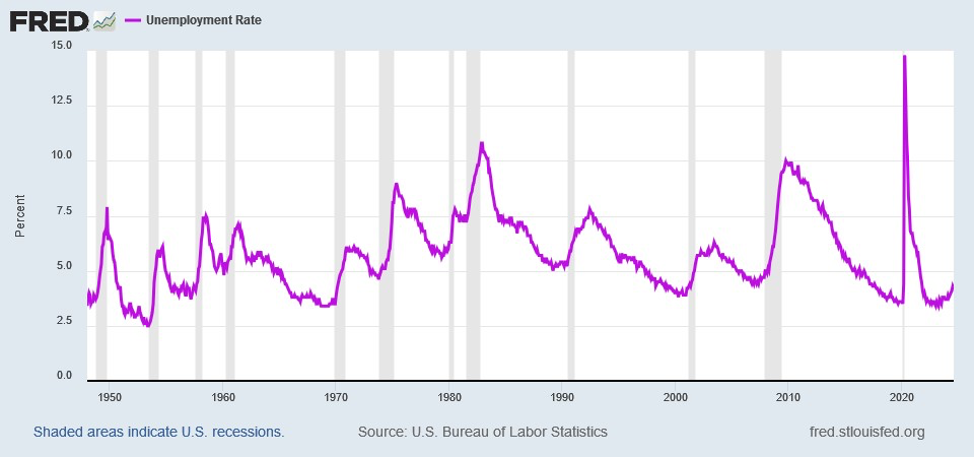
And this agrees with U-3, the statistic the government reports, which shows Unemployment relatively low:
However, these statistics do not reflect the dynamic under the surface. This dynamic indicates that there exists a different reality for the bottom 50% of the income strata. This reality is reflected in U-6, which represents the actual Unemployment statistic reported before 1994. Due to the depth of the recession, the Government wanted to show a better number for the economy by excluding workers previously reported as unemployed:
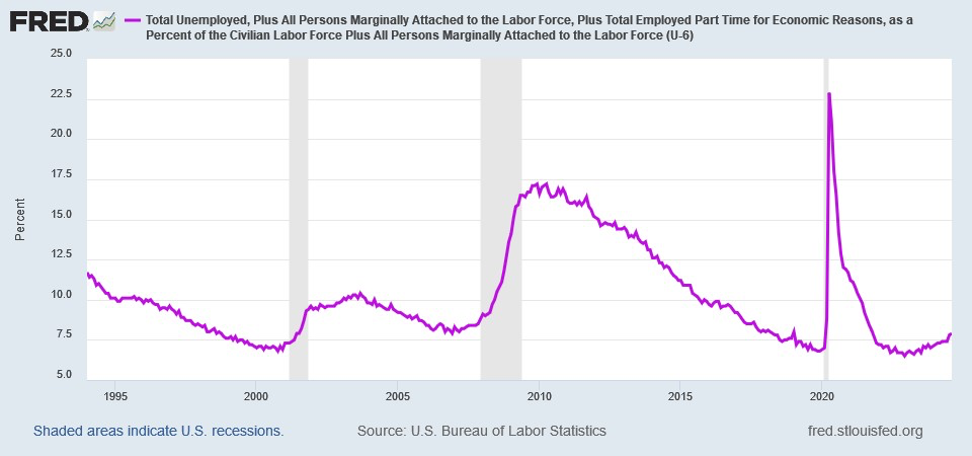
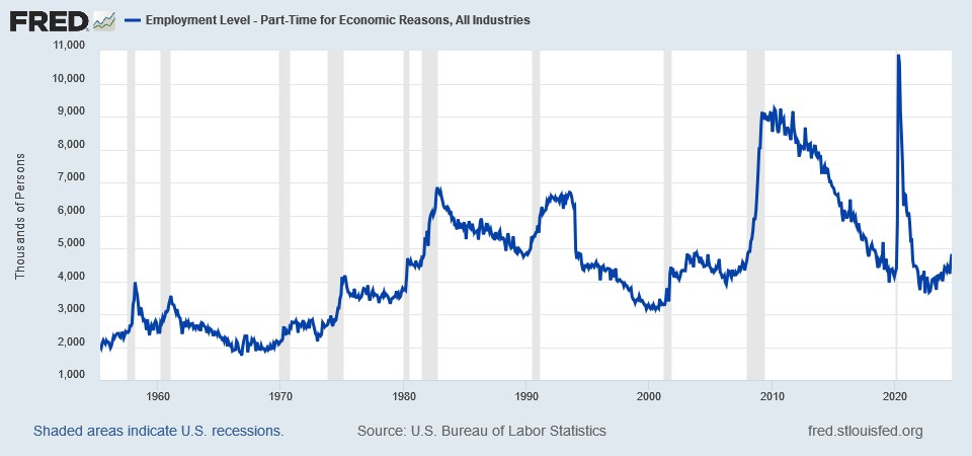
As this chart demonstrates, U-6 Unemployment stands at levels consistent with the early stages of a Recessions prior to 1994. In addition, another employment statistic demonstrates the pressure on the bottom half of the income strata. This is the Full Time Employment vs. Part Time Employment statistics. Over the past year, Full Time Employment jobs fell from 134.7 million to 133.2 million, ~1.5 million:
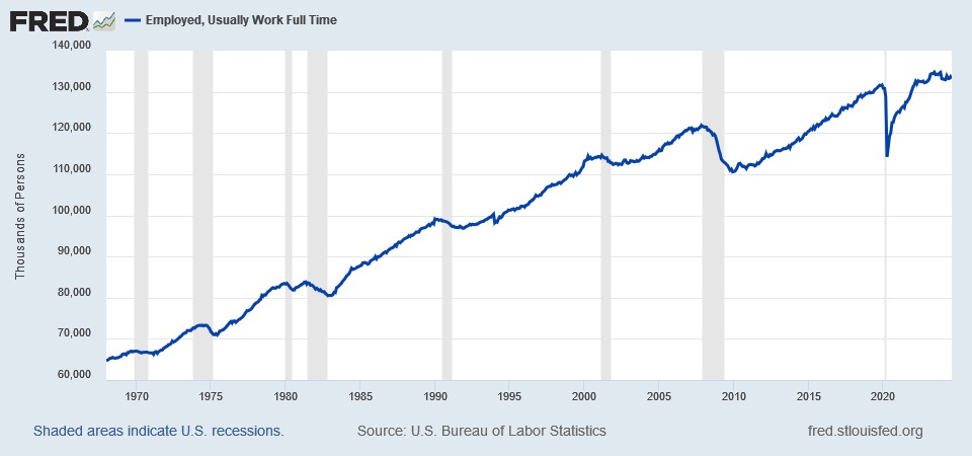
At the same time, Part Time Employment rose from 3.7 million to 4.8 million today or by 1.1 million jobs:
This change for the workers impacted clearly stands a negative as their income took a hit. Based on the breakdown of this data, this shift disproportionately impacted the lower half of the income strata.
In addition to the above, Inflation disproportionately impacted the lower half while creating much less strain on the upper half, especially the Top 20%. To understand this dynamic, Food, Shelter, Transportation, and Medical make up 65%+ of the bottom half’s spending. With costs of everything they buy up 50% or more and incomes up less than half that, the bottom half stands in the midst of an Income squeeze. In contrast, basic costs make up less than 50% of the top half’s spending. Much of this is due to the fixed mortgages that decline as a percent of income over time due to inflation in wages and real growth in wages. This contrasts with the bottom 50% who rent, where rent increases typically rise at or above Inflation. As a result, Incomes for the Top 20% kept up with cost increases, as these basic costs stand a much smaller percentage of their income and some are fixed over the long term. In addition to the income side of the equation, the asset side benefitted this segment as well. The rising stock market boosted 401k’s, private asset values rose, and other assets saw their value increase for those that could afford to invest in these areas. In addition, the value of homes soared by 50% over the past few years. In other words, the Top 20% benefitted massively from these valuation increases.
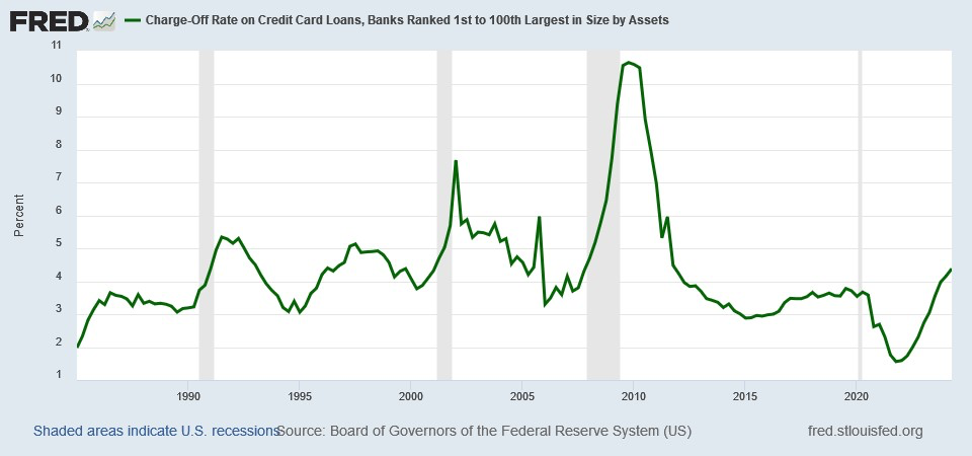
To truly understand how these differences in costs relative to incomes impact the Consumer, one need just look at the credit data. For Consumers with strong Credit Scores, credit losses on credit cards, having given up their Pandemic boost, remain well in check:
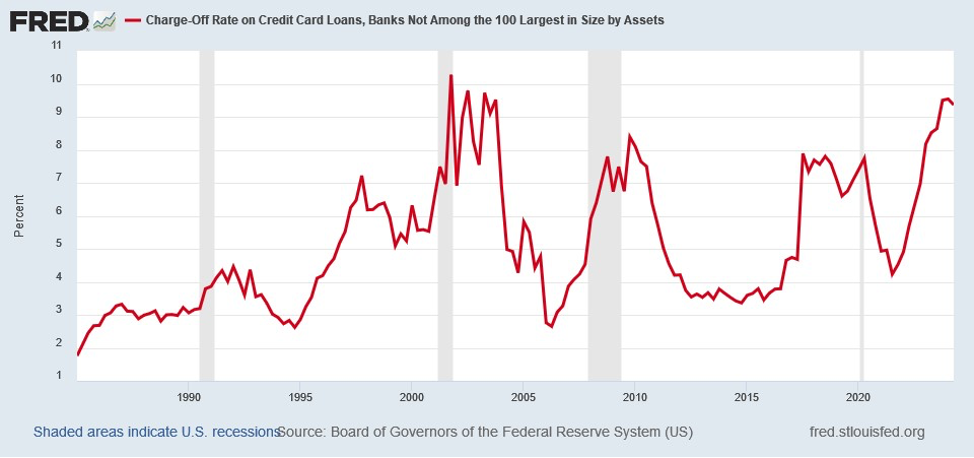
In contrast, Consumers in the bottom half stand in trouble. The data for the smaller banks, which stands as a proxy for this group, demonstrate rising delinquency rates at Recession levels:
To put this in perspective, the auto lender Ally Financial just announced that delinquency rates jumped again in July and August after having risen from 3.6% to 4.3% over the past year. A recent report by Bank America makes clear the stress on this lower cohort in areas like auto loans. Auto loan monthly payments have risen closer to 35% for the lowest income cohort, while only rising ~25% for the Top Quintile:
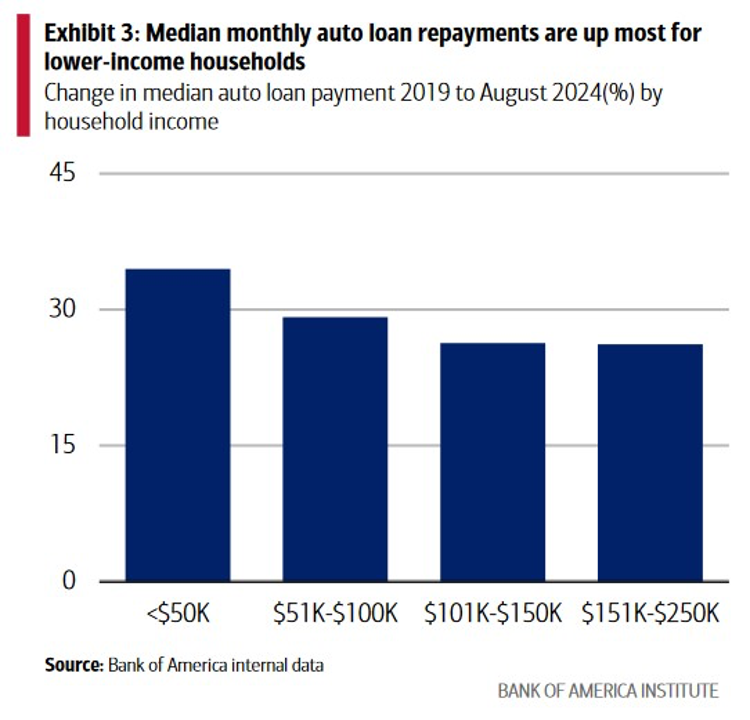
Please see: Caution on the Road Ahead by the Bank of America Institute. The piece can be found at: https://institute.bankofamerica.com/content/dam/economic-insights/consumer-morsel-auto-loan-caution.pdf
These types of changes seem more reminiscent of those typically seen during Recessions than during Expansions. So, despite the Atlanta Federal Reserve’s GDP Now indicating that Q3 growth should achieve a 3% growth rate, Back to Normal for the US Economy, for those in the bottom half it feels more like a Recession. And the data would indicate that their experience conforms to the typical Recession data. In other words, the Consumer possesses a Split Personality. And for those wishing to understand the Economy and the current political split in the country, the data provide a simple explanation. The Top 20% continue to benefit from the trends unleashed by the Federal Reserve and the Federal Government. In contrast, the Bottom 50% continue to take the brunt of the hit from these trends. As one would say, for The Consumer, life appears Back To Normal But With A Split Personality.
The CEO Change, The China Squeeze, and Oh Where Did He Go?
Finally, we close with brief comments on the CEO Change, The China Squeeze, and Oh Where Did He Go? First, prominent companies have been throwing out their CEOs in the hopes that a fresh face will solve al ills. And Wall Street seems to like this trend, for stocks such as Nike and Starbucks got the royal boost when announcing this change. As a result, we see more companies adopting The CEO Change. Second, foreign auto companies in China continue to feel the squeeze. Mercedes Benz and BMW both announced that their auto sales in China stood disappointing. They stand just the latest in a long line of foreign auto companies feeling The China Squeeze. And Third, Sportsman Warehouse announced disappointing sales as the lure of the great outdoors evidently could not outweigh the squeeze on their customers due to Inflation for all things that they consume. As a result, we see them asking about their customers: Oh Where Did He Go?
In Closing
Should you have any questions on how the above issues or the items discussed in our accompanying cover letter impact your family’s financial position or your business’s future as well as the potential actions you could take in response, please do not hesitate to contact us. We welcome the opportunity to discuss this with you.
Yours Truly,

Paul L. Sloate
Chief Executive Officer