Equity Markets: Valuation, That Pesky Cost of Capital, & The Long Term

Views From the Stream
The Monthly Letter covers two topics this month. First, we provide a long term view of the Equity Markets. With Long Term Valuation at historical highs and the Cost of Capital rising, Investors face a difficult reality check ahead. Many assets, such as Real Estate and Private Company Valuations, took major adjustments downward due to the rise in the Cost of Capital. Equities remain Last Man Standing. Typically, they catch up to other asset valuations with a lag. And the adjustment felt elsewhere still lies in the future for the Equity Markets. Second, as always, we close with brief comments of interest to our readers on a variety of current topics relevant to the economy and the markets.
Equity Markets: Valuation, That Pesky Cost of Capital, & The Long Term
“Mr. Market does not always price stocks the way an appraiser or a private buyer would price a business. Instead, when stocks are going up, he happily pays more than their objective value; and, when they are going down, he is happy to dump them for less than their true worth.”
“In the short tun the market is a voting machine, but in the long run, it is a weighing machine.”
The Intelligent Investor
By Benjamin Graham, 1964
When I was growing up, I remember visiting my Uncle’s office every time I went into New York City on the train, back in the 1970s. His office was located just above Grand Central Terminal on the ground floor in the Pan Am Building. So, I needed to pass it on the way in and out of the building. He possessed a special office, up above the rest of the people there, as he managed the office. The best part of visiting the office stood the magical electronic billboard which displayed stock tickers and the prices at which they just transacted. Some days it moved slowly, while other days it stood a blur as it tried to keep up with the volume of trades. I grew fascinated by what determined those prices. I asked him all sorts of questions, which he patiently answered. As a result, I started learning all about companies, what they did, how things went right and wrong over time, and why their prices went up and down. And, most importantly, he showed incredible patience with my teenage self that had no clue about the stock market or the way things worked, but asked an endless series of questions.
Then, after studying economics in college, I began to read books voraciously on investing, as there evidently were many ways to approach things and many things in which to invest from stocks to real estate to bonds to oil wells to companies to … This included reading books on investing in stocks, bonds, real estate, private companies, oil, and many other areas as well as how options worked, what drove commodity cycles, M&A arbitrage, hedging, financial statement analysis, the role of the Federal Reserve, how money worked, the banking system, interest rates, economics, future trends, government policy, tax incentives, technology, … Of course, I thought this was something that every early 20-something year old did. Just like when I was in college and we computed on the back of a napkin at lunch one day the critical mass for an atomic weapon. Absolutely normal. At the end of all this research, three things became crystal clear. First, the Federal Reserve created an outsize impact on the economy and the markets with monetary policy and interest rates. Second, Economic Trends impacted how companies and industries fared over time and government incentives could have an outsized impact. And these trends could offset or ameliorate the impact of the Federal Reserve on the economy. Third, getting both the fundamental Trends and impact of Monetary Policy correct stood critical in evaluating investments and their future valuation. Having studied the Great Depression in school and heard the stories of my grandparents’ experiences during that time, and having lived through the Inflationary 1970s, it became clear to me that interest rates, inflation, and economic conditions can change dramatically and over short periods of time, with significant consequences for investing.
All of this comes to bear when thinking about today’s Equity Markets and potential future paths. Equity Markets today stand in rarified air, seen only a few times over the past 150 years:

Data courtesy of Robert Shiller, Yale University and can be found at: http://www.econ.yale.edu/~shiller/data.htm
As the Data demonstrates, Valuations today exceed the 1929 Stock Market peak and stand well above all prior valuation peaks excluding that of the 2000 Tech Bubble. This data is confirmed by other indicators such as Tobin’s Q, named after the Nobel Prize winning economist:
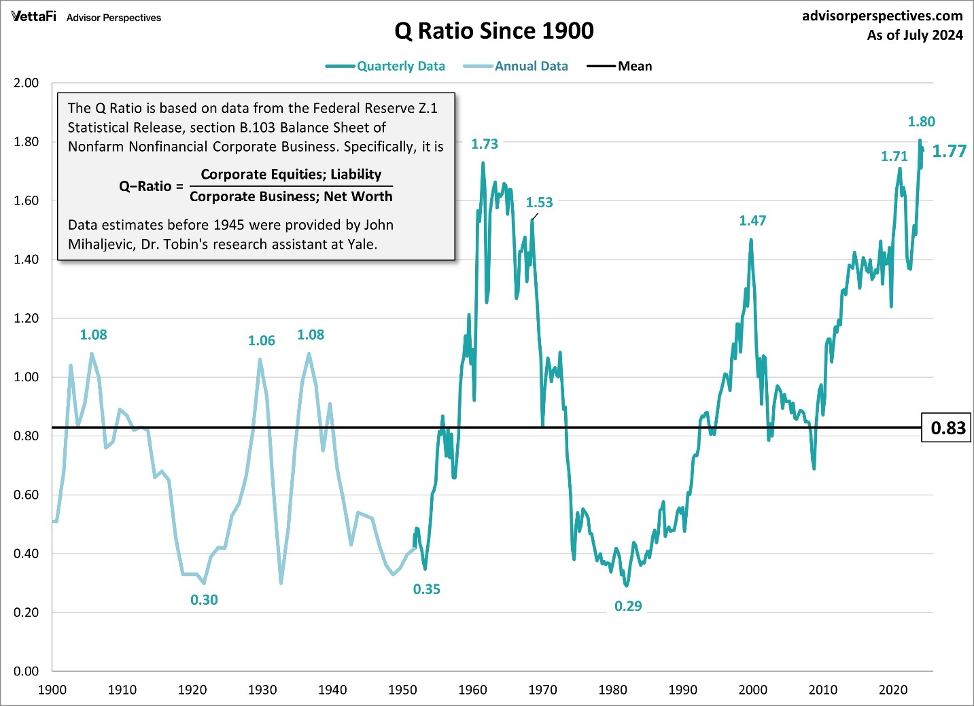
Chart courtesy of www.advisorperspectives.com .
In addition, the “Buffett Indicator”, which measures the value of the Equity Markets relative to U.S. GDP, stands similarly at an all time highs:
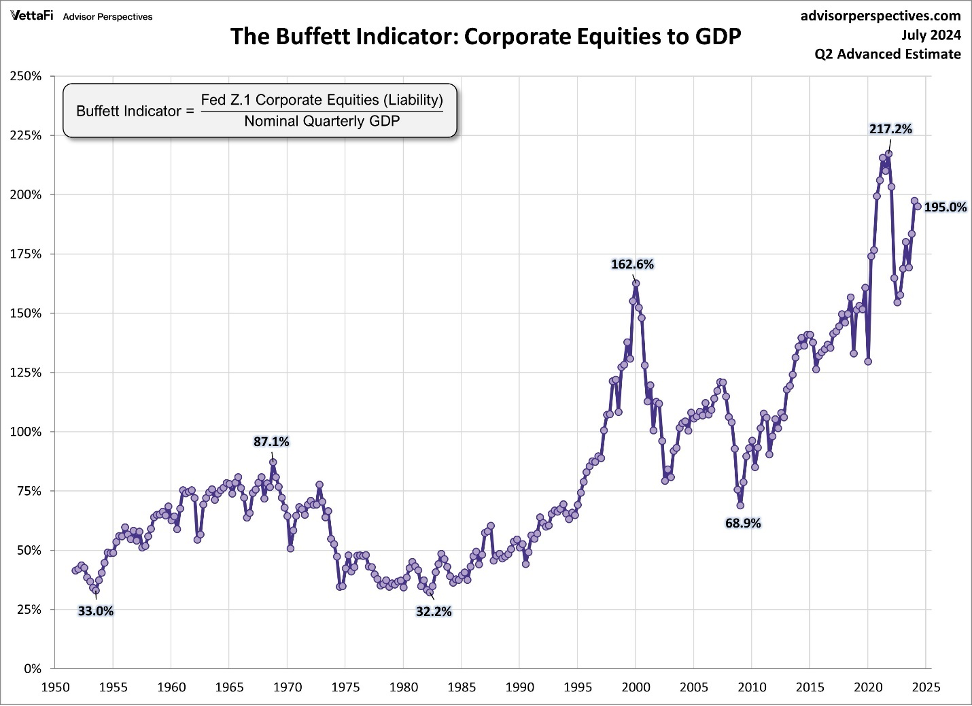
Chart courtesy of www.advisorperspectives.com .
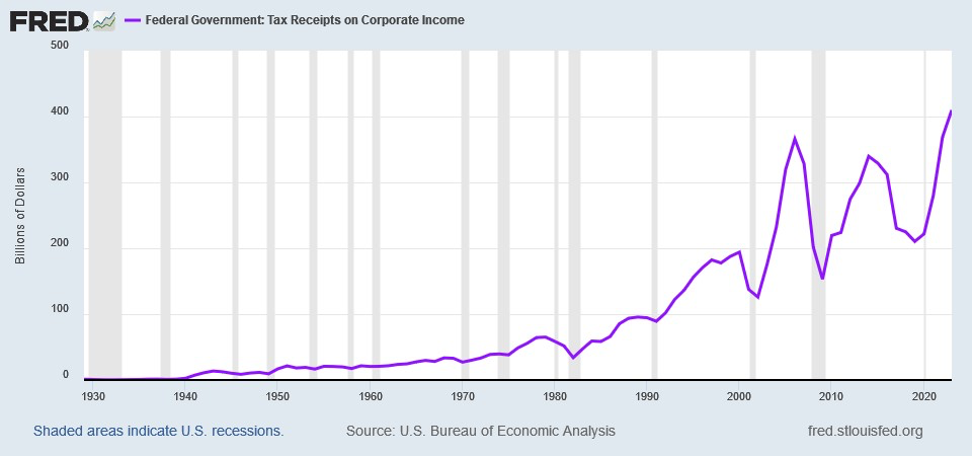
These Valuations are occurring at the same time as a number of interesting trends. First, Corporate Taxes appear low relative to the economy. As the following chart makes clear, Corporate Taxes collected by the Federal Government, as of 2023, stand just 12% above their level in 2006. This is despite the economy growing by 98%, in nominal dollars, over this time frame:
Thus Corporate Taxes Collected relative to GDP stand at a low level:
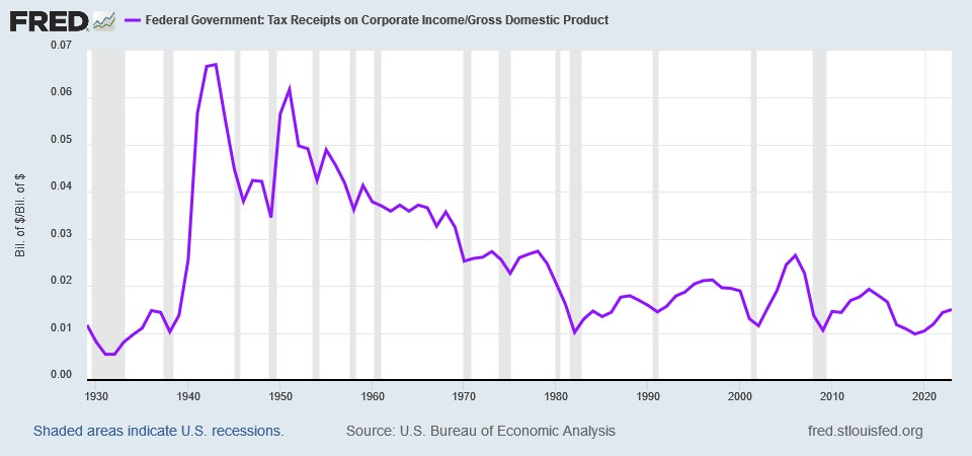
And have fallen from 2.65% of GDP in 2006 to just 1.50% in 2023. This stands well below the 1990s levels as well as below the 1980s levels, both of which represented times when the economy grew at a faster rate. Should the Federal Government return Corporate Taxes to prior levels, this would represent a hit to most companies’ bottom line and cash flow.
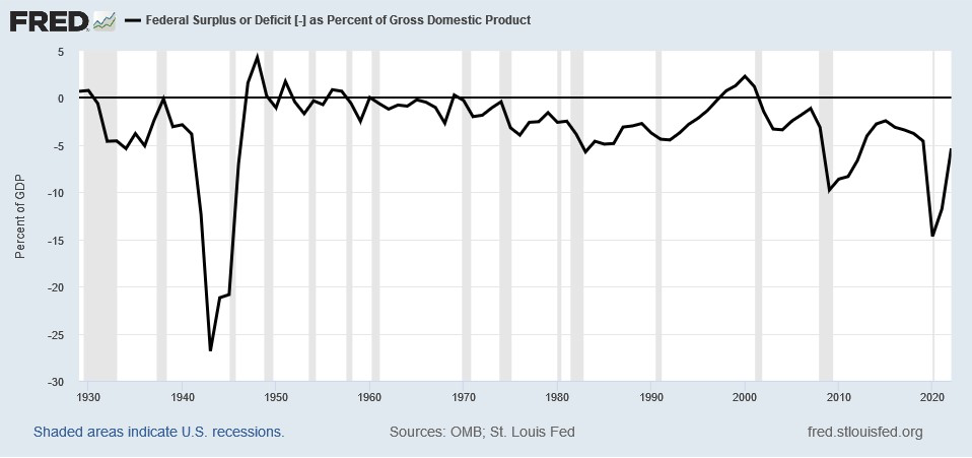
Second, Federal Government deficits relative to GDP stand high outside of a Recession:
At the same time, Debt to GDP rivals peak World War II levels:
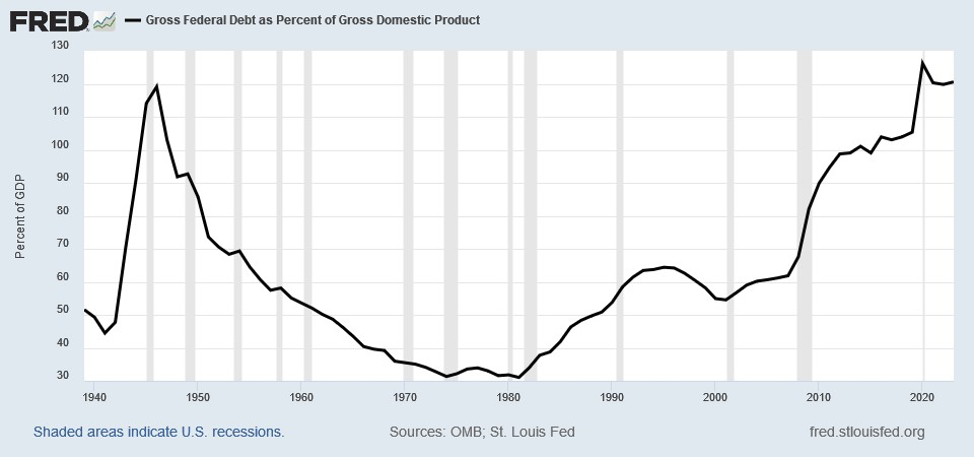
While there are solutions to this predicament for the US Government, they all entail some combination of higher taxes, controlling spending, encouraging growth, and higher inflation.
Third, Interest Rates appear to have bottomed from a long term perspective and have begun to unwind their decline since the prior peak in 1980:
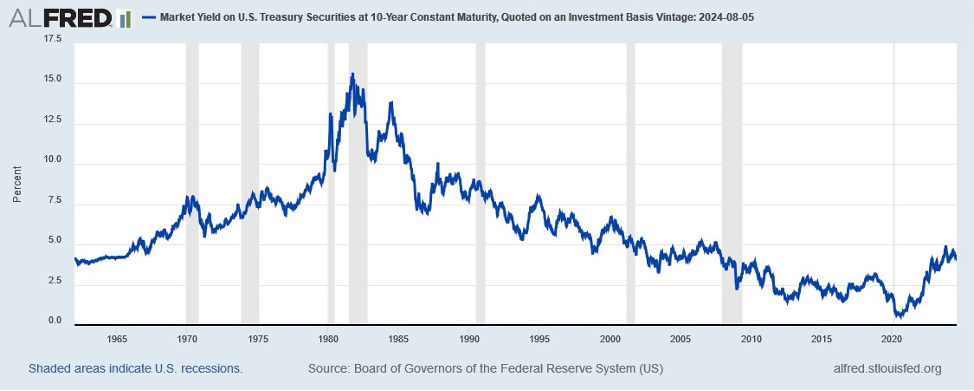
And while long term moves in rates are never unidirectional, with cyclical pullbacks occurring periodically, such as at present, given the typical multi-decade movement once direction changes, rates likely began a long term move upward over the past few years. And if part of the Federal Government’s solution to high levels of Debt to GDP includes higher Inflation, as U.S. history would indicate, then a long term rise in Interest Rates makes sense.
While all this stands nice commentary, what does this mean from a practical perspective for investors. The Federal Reserve’s Financial Stability Report from April 2024 provides a glimpse of what this might mean for Commercial Real Estate:
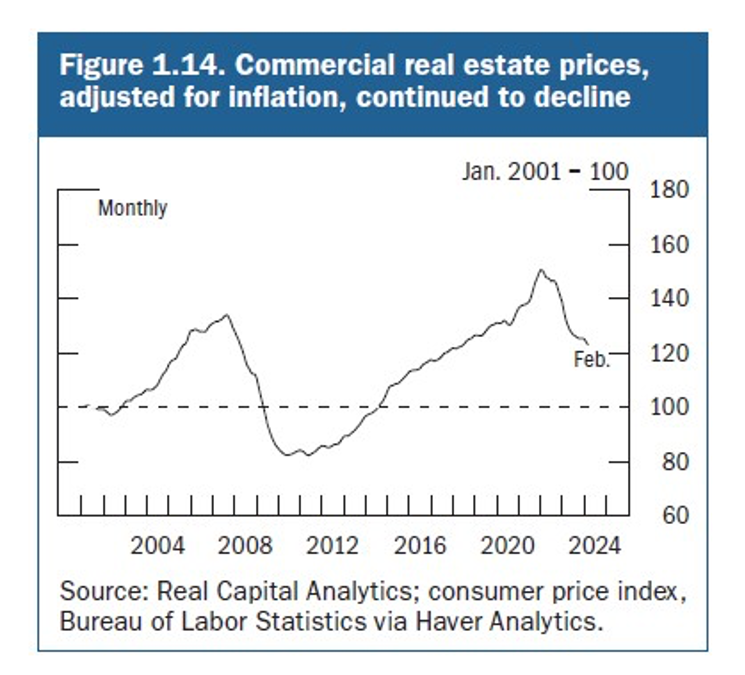
Financial Stability Report, Federal Reserve, April 2024
As this graphic illustrates, rising interest rates directly impact Commercial Real Estate Values in a negative manner. This makes intuitive sense, as Discounted Cash Flows (DCFs) determine most Commercial Real Estate valuations. And DCFs decline as interest rates rise and increase as interest rates fall, assuming no change in the future Cash Flows.
Other areas of investing demonstrate similar impacts from rising interest rates. The Mexican Standoff in Private Equity (PE) stands one. As noted in the April, 2024 piece, Oh, Those Poor Private Equity Firms, there stands a record number of unsold companies owned by PE firms. This inability to sell companies at prices needed to make promised return hurdles comes down to the cost of debt and the impact on private company valuations. As noted in that piece, a rise of just 2% in funding costs cuts the valuation of private companies by ~30%, a not insignificant impact. Other assets, such as timber, mines, oil wells, data centers, …, all suffer similar impact from the rise in Interest Rates. More simply put, That Pesky Cost of Capital leaves no asset untouched. Bless its heart.
This leaves the curious case of the Equity Markets. As the data above indicate, today’s Equity Markets seem impervious to the rise in the Cost of Capital. As Benjamin Graham noted, markets do not necessarily price assets rationally in the short term. Numerous bubbles and periods of overvaluation litter stock market history. If the markets acted rationally all the time, these bubbles and overvaluation periods would not exist. However, they do, as history demonstrates. Unfortunately, which history also demonstrates, these bubbles and periods of abnormal valuation always unwind. And they usually do so in a painful manner over a short period of time. The following dot plot shows the long term relationship between the Shiller CAPE and Inflation:
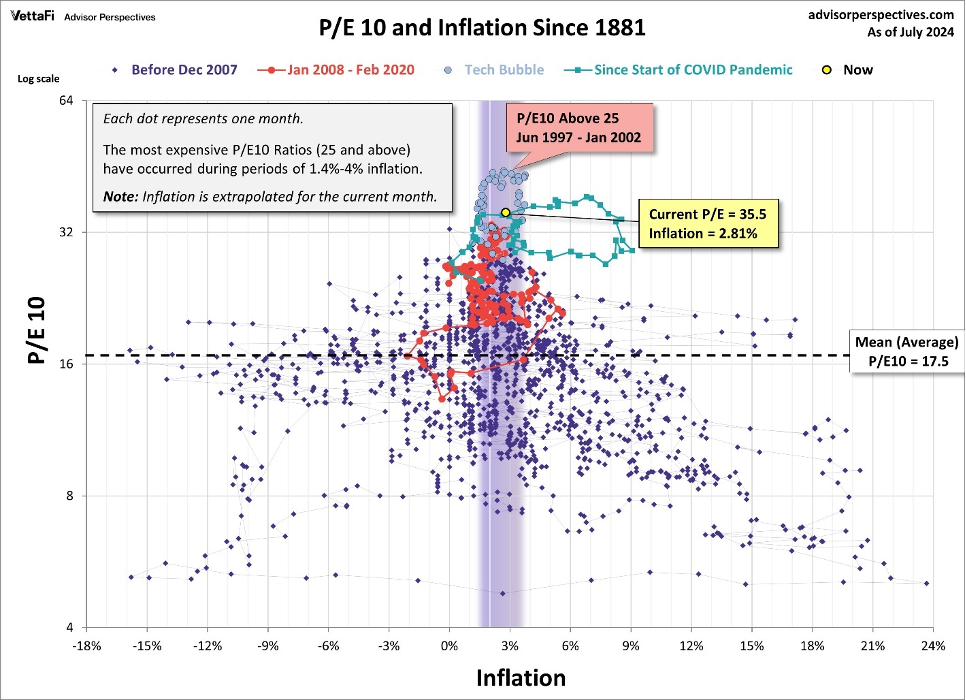
Chart courtesy of www.advisorperspectives.com .
The chart provides a simple but clear message. Today’s CAPE stands more than twice the average level. And averages are composed of periods both above and below the average. Should the CAPE return to average valuations, P/E’s could get cut in half. To put this into perspective, the following example will demonstrate what this math would mean over the long term. It assumes that corporate profits grow at the rate of Nominal GDP of 8% over the long term:
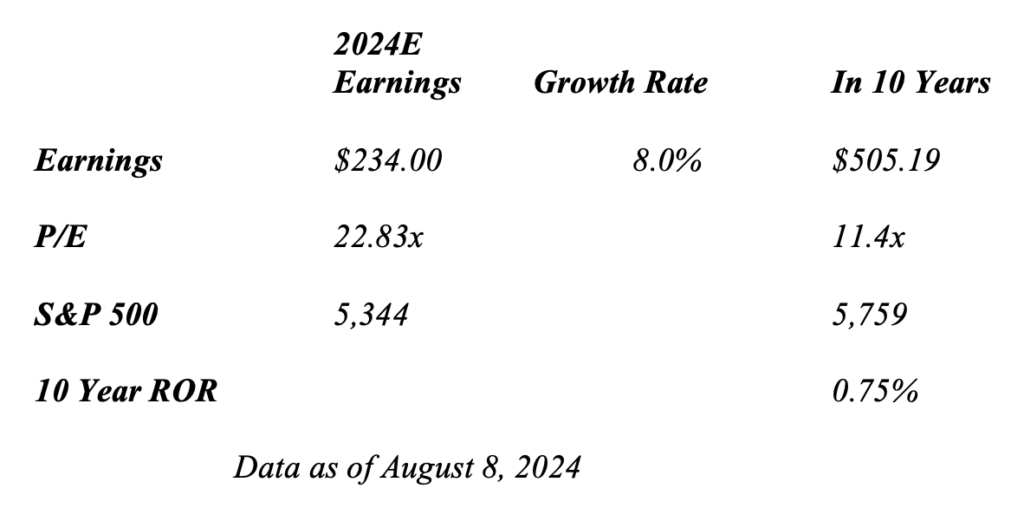
As the table indicates, Long Term Returns could massively disappoint investors should valuations return to the mean. For those who have indexed, which represents well over half of investor holdings in the Equity Markets, this could prove a disaster for their retirement savings. The question that clearly stands out can be framed as follows: Is this realistic and/or possible? This history of the past 100 years would unfortunately say Yes. While the Equity Markets possess long periods of strong returns, they also possess long periods of no return. The following data for the S&P 500 demonstrates the manic depressive nature of the Equity Markets:
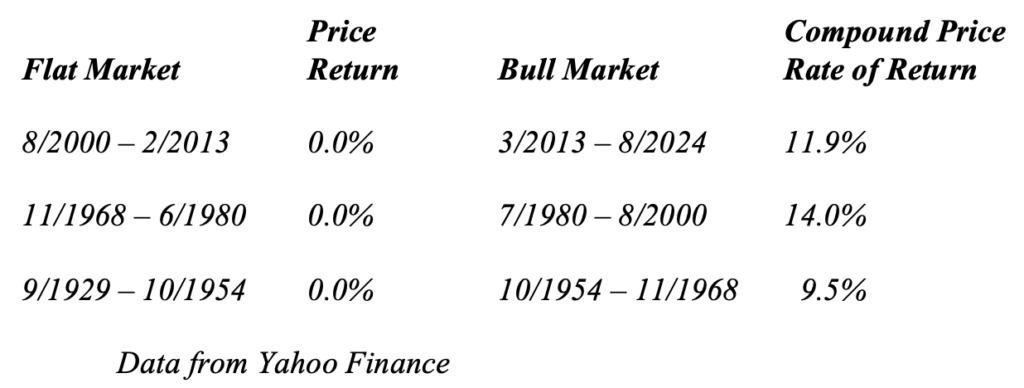
While the above data exclude dividends, they make clear that the S&P 500 can possess long periods when the Index goes sideways. And this makes sense as most long term studies of the Equity Markets show them compounding at 8% to 9% over the long term with Dividends Reinvested.
There exist two issues, in addition, that likely will impact investor returns over the next decade. The first is Taxes. With the U.S. Federal Government running large Budget Deficits in an economic expansion, there clearly exists a need to address the gap between Revenue and Spending. Unfortunately, as pointed out in The Great Game of Power: The Winds of War, The Once and Future Economy, A Modern Marshall Plan, & The Free World vs. Totalitarianism, Once More, published February 28, 2024, the flexibility of the U.S. to cut spending or limit spending growth similar to what occurred in the 1990s stands limited. External threats, social programs, and the need to rebuild its defense and industrial capabilities will limit any cuts in Spending. As a result, Taxes likely will rise once the Presidential Election cycle ends, regardless of which party ends up in the White House. Should Congress not address this yawning chasm, there likely will stand a revolt in the Financial Markets as the Bond Market Vigilantes ride into town. (Please see The Wild West & The Return of Vigilante Justice – Part 2, published September 30, 2023, and The Wild West & The Return of Vigilante Justice, published March 15, 2021.) Given the need to raise Taxes across the board, both personal and business, to close the gap, no area will remain untouched including sacred cows such as Private Equity and Real Estate. Assuming Corporate Taxes relative to GDP rise back to the level that existed during the 1980s and 1990s, as the Federal Government needs to collect cash, Corporate Taxes could rise from their current Stated Tax Rate of 21% to 35% or more and the Effective Tax Rate could rise from 15% to 25% – 30%, depending on limits on deductions. This means Corporate Cash Flow will take a 15%+ hit. This would create an additional 1.4% per annum drag on Equity Returns over a decade.
The second factor facing investors stands an old nemesis, Inflation. Not only does Inflation impact Interest Rates and Spreads, it also impacts the Rate of Return needed to generate a specific Real Rate of Return After Tax. While there exists the temptation to give the Federal Government the benefit of the doubt, history demonstrates that the United States chooses Inflation to address large amounts of Government Debt. It never pays off its Debts in US Dollars worth anything close to their value when borrowed. Thus, investors should assume that, regardless of government statements, Inflation will rear its head in the not too distant future. And Inflation possesses significant impacts on capital investment and the Required Rate of Return to justify a project. A simple example will make clear this impact. Assume that Inflation runs 3%, US Treasuries yield 4%, and Corporate Debt stands 2% above that at 6%. This assumes a state of affairs similar to today. Assume that Inflation rises to 6%. This would drive Treasury Yields to 7% and Corporate Debt to 9%+. There exists a project that needs a 3% Real Rate of Return after Taxes and Inflation on the Equity invested into the project. For simplicity’s sake, assume the project costs $100.00 to build. The following Table lays out the math involved:
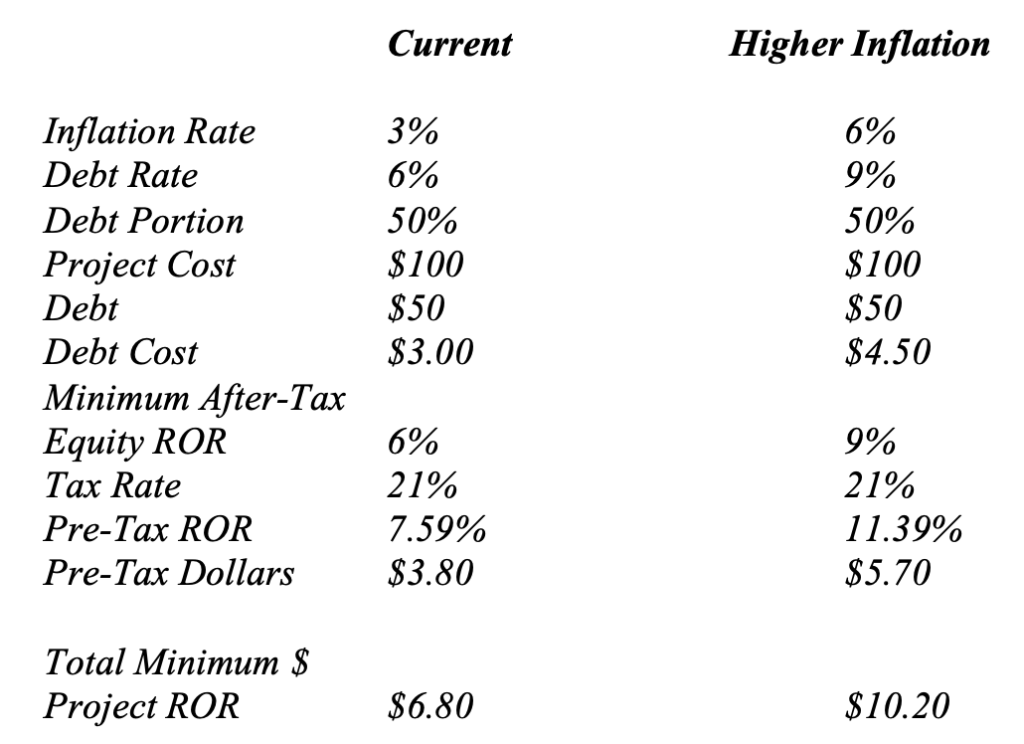
As this simple example makes clear, required pre-tax returns on an investment rise by 50% for a 3% increase in Inflation to generate the same 3% Real After-Tax Rate of Return. If Corporate Taxes stood at 35% or more, as they might in the not too distant future, then the Pre-Tax ROR for Equity rises to 13.85% and the project must generate an 11.44% return. This compares to just 7.59% today for Equity and 6.80% for the overall project.
In addition to impacting project economics, Inflation impacts Valuations of Assets. This makes intuitive sense as Discount Rates rise in DCF calculations. And it would reinforce the compression in Valuation in the Equity Markets, as the graphic on P/E 10 and Inflation above makes clear. Should Inflation rise to 6% in what becomes viewed as a semi-permanent fashion, then the P/E 10 could fall to low double digits or high single digits. This would create a compression in Valuations of 65% to 75% from today and could turn the forward 10 Year Rate of Return into a Negative Number. While high levels of Inflation would likely boost nominal profits, causing them to grow at a rate in excess of their 8% long term rate, the history of such periods indicates P/E compression more than offsets the increased rise in Nominal Profits as markets look through them to Real Profits. In addition, Investors should consider the impact of Inflation on the Real Value of their holdings. In the case where Inflation averages just 4% over the next decade, the value of a Dollar drops 32.44%. In the case where Inflation averages 5%, then the value of a Dollar drops 38.61%. Investors should note that in decades like the 1940’s, according to the CPI, Inflation averaged 5.5% for the decade. And in the 1970’s, official Inflation averaged 7.5% for the decade. (This stands a different number for the 1970s than published in 1980. The famous cover of Time magazine published that year showed the US Dollar only buying 33% of the goods it did in 1970. Should this stand closer to the truth, then the Inflation Rate averaged 11.6% for the decade.) As these historical examples illustrate, Inflation stands the rule not the exception. Given this, Investors should adopt Caveat Emptor when thinking about forward returns.
For Equity Markets, Valuation stands in rarified air. On top of this, That Pesky Cost of Capital appears headed up over the rest of the decade. And Inflation likely will rear its ugly head again in the not too distant future as the Federal Government moves to address the massive amount of Federal Debt. For Investors, Long Term Returns may disappoint as Equity Markets grapple with this future reality. And the Real Value of their holdings may decline as Inflation rises and Valuations compress, leaving the Nominal Value of their holdings flat. For Investors, that fine print that reads, “Past Returns stand no indication of Future Returns”, may truly come home to roost. And they may end up experiencing one of those magical periods, reminiscent of the decade of the 2000s and the 1970s, once more.
Not Leaving On A Jet Plane, Cruising, & Those Happy Meals
Finally, we close with brief comments on Not Leaving On A Jet Plane, Cruising, and Those Happy Meals. First, consumers appear to have had their fill of travel. Hotels of all types, from Marriott to Motel Six, report a slowdown in demand. Even Disney indicated a significant slowdown impacting its business. For the travel industry, the consumer is Not Leaving On A Jet Plane. Second, in comparison to domestic travel, cruise lines are reporting strong demand for their ships. As Royal Caribbean commented in its recent press release, “Exceptional demand for our vacation experiences has accelerated…” Given this, we see the industry Cruising. Lastly, McDonalds recently reported negative same store sales across all regions of the world. In response, the company stated in its latest earnings release, “we are focused on the outstanding execution of delivering reliable, everyday value”. With the company emphasizing its traditional value message and with cuts in prices, we see Those Happy Meals in demand once more.
In Closing
Should you have any questions on how the above issues or the items discussed in our accompanying cover letter impact your family’s financial position or your business’s future as well as the potential actions you could take in response, please do not hesitate to contact us. We welcome the opportunity to discuss this with you.
Yours Truly,

Paul L. Sloate
Chief Executive Officer