Global Economic Quarterly, Part 1: A 1970s Rerun & The Central Banks Come Marching One By One, Hurrah! Hurrah! Reprise

Views From the Stream
The Monthly Letter covers two topics this month. First, we provide our Global Economic Quarterly, Part 1: A 1970s Rerun & The Central Banks Come Marching One By One, Hurrah! Hurrah! Reprise. The US Federal Reserve finally faced the reality of the Law of Unintended Consequences. In attempting to move Inflation upward, through Quantitative Easing, they appear to have opened Pandora’s Box, acting much like the Federal Reserve did in the late 1960s and 1970s. Recognizing this reality early this year, Chairman Jerome Powell left the word “Transitory” behind and acknowledged the Inflation driven by the Fed’s Quantitative Easing. In response, the Fed plans to raise rates aggressively and pull money out of the economy. Following on its heels, other Developed Market Central Banks plan to act in concert. When coupled with actions already taken by Emerging Market Central Banks, Global Growth appears set to slow mightily with the potential to end up with more than just a slowdown. Second, as always, we close with brief comments of interest to our readers on a variety of current topics relevant to the economy and the markets.
Global Economic Quarterly, Part 1: A 1970s Rerun & The Central Banks Come Marching One By One, Hurrah! Hurrah! Reprise
“Those who cannot remember the past are doomed to repeat it.”
The Life of Reason
By George Santayana, 1905
For those of us who remember disco shoes and silver coins and pink Cadillac’s, the current economic setup seems strangely reminiscent of those days. As one might say: Same Bat Channel, Same Bat Time. In the late 1960s, with the Vietnam War continuing to heat up, strong economic growth led the economy to overheat, producing real inflation for the first time since the 1940s. After running at ~1.5% from 1959 – 1965, Inflation began a steady creep upward, reaching 3.5% in late 1966. With Inflation creeping up, so did the Federal Reserve’s interest rates, moving from 3.5% in 1964 to 5.75% in late 1966. As a result, the economy slowed, leading the Fed to begin to lower rates. With the Fed easing monetary conditions, the US economy reaccelerated and so did Inflation. From a low of 2.3% in 1967, Inflation soared to 6.0% by late 1969. Of course, the Fed responded by raising interest rates in lockstep with Inflation to more than 9% by August 1969. As a result of this tightening, the economy entered, what came to be known as, the 1969 – 1970 Recession.
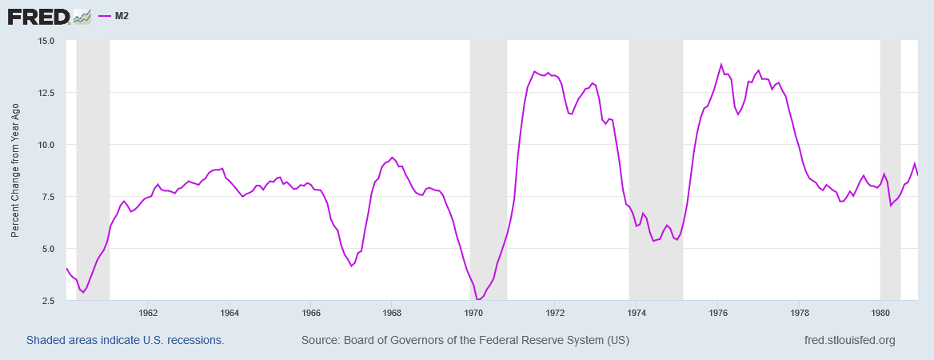
To combat the Recession, the Federal Reserve then lowered rates, dropping rates to under 4% by early 1971. In addition, Money Growth, in the form of M2 accelerated, growing at over 13%, despite GDP Growth that only averaged 4.5% during the 1960s, excluding recessions. Thus, the Fed created extra money to ensure the economy grew. And grow it did. Economic growth reached almost 7% Year Over Year (YOY) by Q4 1972. By early 1973, with the economy growing once more and with the normal 18 – 24 month lag to exiting a Recession, Inflation began to accelerate once more, reaching 6% by June 1973. In response, the Federal Reserve, once more began to raise rates and to slow Money Growth to quell Inflation and to slow Money Growth. Fed Funds, which had crept up to 5% by September 1972, soared, peaking at 10.75% in September 1973. With the economy clearly entering a recession, the Federal Reserve started to lower rates. However, Global Geopolitics intervened. The US supported Israel during the 1973 Arab-Israeli War. In retaliation, OPEC imposed an embargo on the United States and its allies, cutting global oil production by 5%, in what came to be known as the Arab Oil Embargo of 1973. In addition, they quadrupled the price of oil. To no one’s surprise, a spike in Inflation occurred during the Recession given the massive amount of money fed into the US economy over the prior two years and the rise in the price of energy. This caused the Federal Reserve to reverse course and raise Interest Rates during a Recession. Despite what clearly was a blow to the US economy due to the Oil Embargo, Fed Funds hit 13% by July 1974. This prolonged and deepened the US Recession. Coming under political pressure, the Federal Reserve lowered rates rapidly to 5.5% by mid-1975. This allowed the US economy to recover.
With the normal lag, Inflation began to accelerate once more in 1978. And to no one’s surprise, the Federal Reserve acted. Just as earlier in the decade, another Global Geopolitical shock intervened. With the Iranian Revolution of 1978 – 1979, Iranian oil production went offline. Global Oil Production dropped 4%, creating another oil shock. The price of oil more than doubled. Just as in 1973, this caused inflation to accelerate once more; this time hitting double digits. With Inflation a political issue, President Carter appointed Paul Volcker as Chairman of the Federal Reserve. To combat the roaring inflation, Paul Volcker raised rates to 17.50%, ultimately putting the economy into a long deep recession, which brought inflation under control. Due to the depth and breadth of the 1980 – 1982 Recession, Paul Volcker earned the nickname: Darth Volcker.
The following charts illustrate the Fed’s Stop-Start Policy response during the 1960s and 1970s period. The first chart shows the Fed’s up-down monetary growth:
The next chart shows the Fed’s Interest Rate Policy via the Fed Funds Rate From 1954 – 1985:
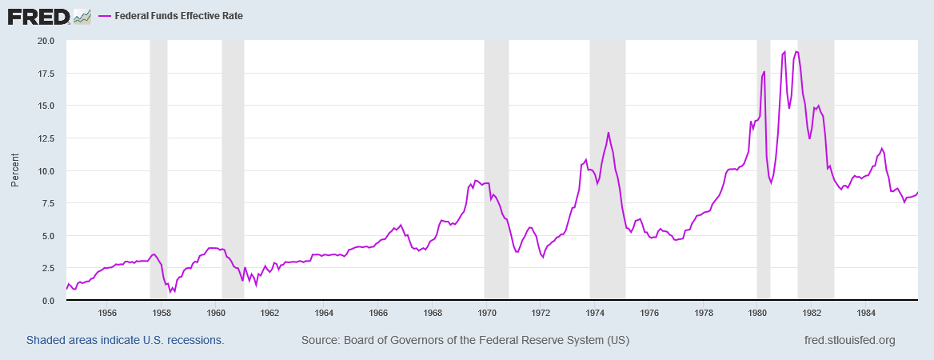
As the chart illustrates, Interest Rates entered a steady upturn in the early 1960s that culminated in the late 1970s/ early 1980s. Rates followed Inflation upward, as the next chart clearly demonstrates:
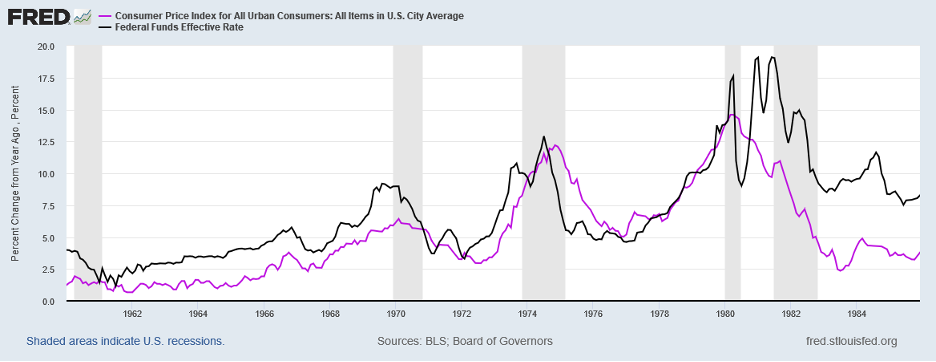
The chart also demonstrates the “Victory” engineered by Paul Vocker in the early 1980s when Inflation returned to more normal levels under 5%. Of course, the Victory by Paul Volcker led to double digit Unemployment and a severe contraction in the US Economy. And if we overlay the chart of Real GDP (purple line) and Interest Rates (black line), using the Federal Funds Effective Rate, the inverse relationship between the two becomes clear:
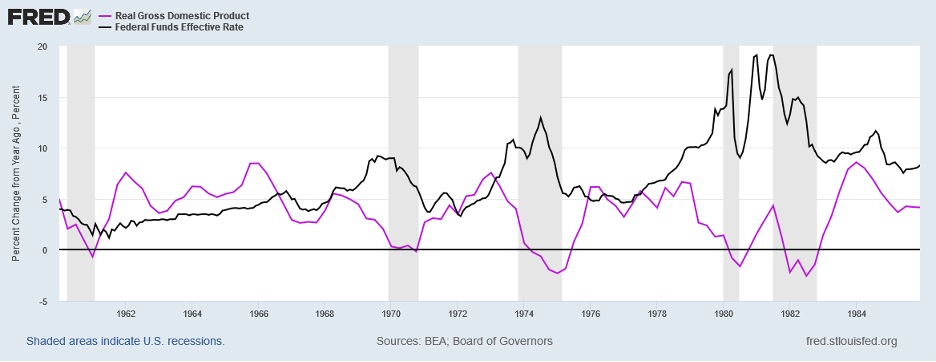
In other words, what the Federal Reserve does creates an impact on the Economy with a lag, regardless of what verbiage is used as political cover for its actions.
This brings us to the present. Currently, the Federal Reserve stands focused on Inflation and lowering Inflation. As numerous Fed officials stated over the past few months, the Labor Market is running “Too Hot”, creating strong wage inflation, and needs to loosen up. From a business perspective, this is code for “WATCH OUT!!!”, as economic growth will face significant headwinds ahead as it acts. (Somehow, the Federal Reserve seems to ignore the impact of declining Real Incomes for the Average Consumer in its discussions and the need for Real Wages to rise in order to catch up with Inflation.) In order to fulfill this goal, the U.S. Central Bank, a.k.a. The Federal Reserve, announced a drastic increase in Interest Rates over the next 18 months. In addition, it announced a major contraction in the Money Supply that will occur simultaneously with the rise in Interest Rates. This will occur as the Federal Reserve stops reinvesting maturing securities in its massive portfolio. Lastly, the Federal Reserve plans to actually sell securities pulling even more money from the economy. Such drastic action will have an impact on the economy regardless of the rhetoric around it. With just a 0.25% increase in rates and a 0.50% increase in rates expected in May, 10 Year Treasury Interest Rates have returned to the upper end of the range since 2010:
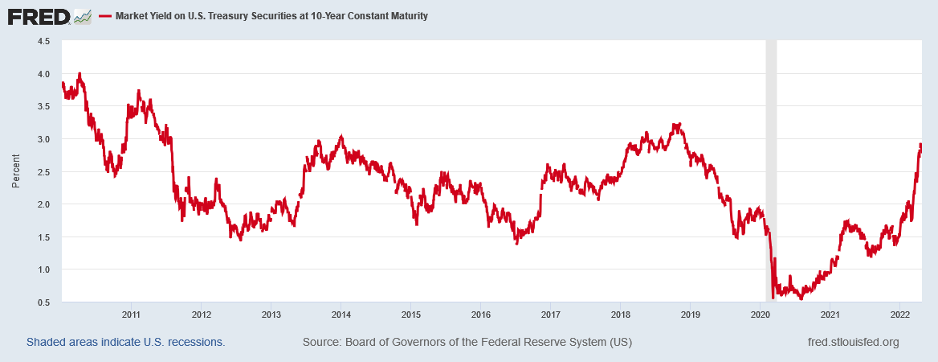
Since January, the 10 Year Treasury Rates rose from 1.75% to 2.90%. While that may seem dramatic, it still pales in comparison to Normalized Yields when compared to Inflation, as the following chart demonstrates:
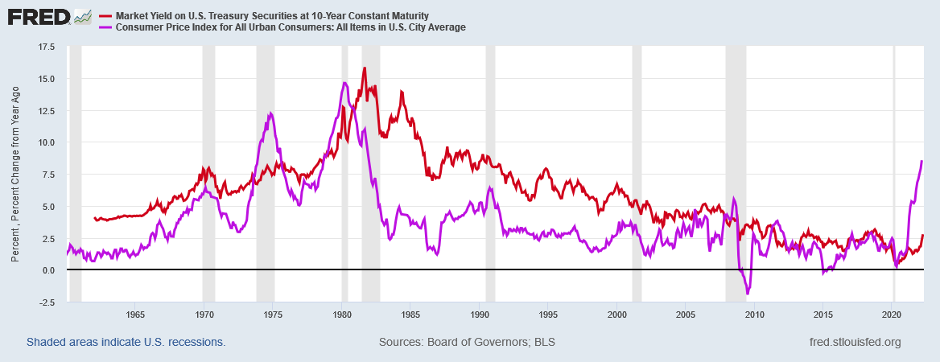
In the early 1970s, when Inflation first took off, 10 Year Treasury Yields stood between 7.00% and 7.50% for a similar level of Inflation. That number is some 4.00%+ above current levels. Reflecting some level of reality, 30 Year Mortgage Rates moved from ~3.00% in early January to over 5.00% currently. However, just as with Treasury securities, the 30 Year Mortgage Rate stood at 8.50%+ in late 1973, peaking at ~10.00% in October 1974. The midpoint of this range, 9.25%, stands some 4.25% above current levels. The only reason Interest Rates stand low relative to Inflation stems from the massive manipulation of Interest Rates by the US Central Bank. Unfortunately, there exists no “Free Lunch” in economics. And controlling Interest Rates below levels market forces would dictate leads to numerous distortions in the economy and markets. This includes the massive Technology Bubble that is currently unwinding in the Equity Markets and the Asset Inflation Bubble for all assets throughout the real economy. This latter Bubble will begin to unwind with a lag to the Equity Markets, likely as economic growth slows later this year and in 2023. This unwinding will produce other problems, especially during the next Recession, but that will occur in the future and, as such, does not sit in the political process as of yet. Or, for example, the manipulation of Interest Rates penalized Consumers who saved money, as they did not receive the Interest they should on those Savings, instead transferring that Income to the Banking System. These are just a few obvious distortions. The actual list stands long.
For the Global Economy, the US Central Bank stands late to the Party. Numerous Central Banks acted to normalize Interest Rates as their economies recovered and to stem Inflation, as it accelerated in 2021. (Please see Global Economic Quarterly, Part 1: The Central Banks Go Marching One By One, Hurrah! Hurrah! published in August 2021.) In general, they acted much sooner than the Federal Reserve. Whether in Singapore, Brazil, Indonesia, Chile, or Nigeria, Central Banks for Emerging Market Economies (EM) acted preemptively to address the massive rise in Inflation due to Oil and Food prices. In contrast, Developed Market Central Banks held off, waiting for the Federal Reserve to act. And once the Federal Reserve announced its plans, Developed Market (DM) Central Banks fell in line including Australia, Norway, the United Kingdom, and the European Union, almost like lemmings. With Central Banks around the world raising rates together, so as not to be left out, the outcome does not stand in doubt. The Global Economy will slow significantly over the next 12 – 24 months. And this stands before the impact of the following factors: the normalization of Global Goods demand back towards its pre-Pandemic share of Consumer spending; the increase in Global Capacity across all goods producing industries to meet this inflated demand; the end to Inventory restocking as companies complete putting in place buffer stocks; and the adjustment by the Consumer to higher prices through decreased demand for Goods to remain within their Incomes. Recent comments by Taiwan Semiconductor (TSMC) about slowing demand for computers and smartphones; a disclosure in LM Ericsson’s Earnings Release about a move “to create a buffer of vital components”; consistent negative unit volumes reported by multiple consumer goods companies; global capital spending at record levels; and rising demand for domestic and international travel demonstrate early datapoints that show these issues may come to the fore sooner than later. All of these factors will slow Global Growth on top of Central Bank actions.
While The Central Banks Go Marching One By One, Hurrah! Hurrah!, the Global Economy already stands on the cusp of a commodity shock induced slowdown. The Central Bank actions, late to the party as they often are, will only exacerbate the slowdown, potentially turning it into a Global Recession. Numerous global indicators, such as the Baltic Dry Index or the Freightwaves SONAR US Spot Truckload Index, indicate the Global Economy already entered a slowdown. And with Global Goods Demand slowing or turning negative, as Consumers shift their spending to Services and adjust for the soaring prices of Oil, Food, and Consumer Goods, Global Inventories could build rapidly, leading to an abrupt slowdown in Global Manufacturing. The US Manufacturing Purchasing Managers Index for March (https://www.ismworld.org/supply-management-news-and-reports/reports/ism-report-on-business/pmi/march/) already hints at this with the ratio of New Orders to Inventories falling below 1.0 for the first time since the US Government ordered Pandemic Shutdown in the first half of 2020. And this cyclical slowing excludes the secular slowing in China. For those of us looking to relive our youth, by putting on our disco shoes and powder blue tuxedos while dancing along with John Travolta in Saturday Night Fever to the Bee Gees smash hit Stayin Alive, it looks like A 1970s Rerun, with Central Banks following a Stop-Start Policy producing numerous gyrations in Interest Rates, Inflation, and the Global Economy.
Cement Shoes, One Way Trip, and Growing Electronics
Finally, we close with brief comments on Cement Shoes, One Way, and Growing Electronics. First, major manufacturers of cement have announce an additional price increase for July 1 of 6%+. This stands on top of a price increase in January, which put cement prices up 10% year over year. For those needing to purchase cement for roadways and buildings, it must feel like they are donning a pair of Cement Shoes. Second, scientists at TU Delft in the Netherlands, utilizing a novel quantum material developed by physicists at Johns Hopkins University, created a new superconducting diode. This diode moves current in one direction, eliminating the need for magnetic fields in semiconductors and increasing the speed of the device by 300 – 400 times. If the team can take the superconductor from the extreme cold where it currently works (-196º C, -321º F), to room temperature it would revolutionize the semiconductor industry. For these scientists near The Hague, they are hoping to take the world on a One Way Trip. And Third, Scientists in Japan literally grew electronics by developing Nano-Cellulose Paper that allows for design and control of the electrical properties. This nano-paper possesses potentially wide application in wearable sensors, use as an electrode for biofuel cells, and generation of energy for light. Some day soon, we may be Growing Electronics.
In Closing
Should you have any questions on how the above issues or the items discussed in our accompanying cover letter impact your family’s financial position or your business’s future as well as the potential actions you could take in response, please do not hesitate to contact us. We welcome the opportunity to discuss this with you.
Yours Truly,
Paul L. Sloate
Chief Executive Officer
Confidential – Do not copy or distribute. The information herein is being provided in confidence and may not be reproduced or further disseminated without Green Drake Advisors, LLC’s express written permission. This document is for informational purposes only and does not constitute an offer to sell or solicitation of an offer to buy securities or investment services. The information presented above is presented in summary form and is therefore subject to numerous qualifications and further explanation. More complete information regarding the investment products and services described herein may be found in the firm’s Form ADV or by contacting Green Drake Advisors, LLC directly. The information contained in this document is the most recent available to Green Drake Advisors, LLC. However, all of the information herein is subject to change without notice. ©2020 by Green Drake Advisors, LLC. All Rights Reserved. This document is the property of Green Drake Advisors, LLC and may not be disclosed, distributed, or reproduced without the express written permission of Green Drake Advisors, LLC.