Commodities: Thank You For The Green Energy Driven Boom

“This land is your land, this land is my land
From California to the New York Island
From the Redwood Forests to the Gulf Stream Waters
This land was made for you and me.”
This Land Is Your Land
Words and Music by Woody Guthrie, 1944
The environmental movement came into its own in the 1960s, literally sparked by a series of environmental disasters. These included the Houston Ship Channel catching fire, the impact of mercury from power plants in Japan, and the Love Canal toxic chemical waste disaster in Niagara Falls. Out of incidents such as this, coupled with the publishing of Rachel Carson’s Silent Spring in 1962, the environmental movement was born. As the basic, fundamental issues of clean air, clean water, and clean earth were addressed in the 1970s and 1980s, the environmental movement looked for new causes to champion. Their initial target was coal produced power, which creates all kinds of emissions unlike natural gas or nuclear power. Through a series of regulatory moves, the environmental movement forced coal power producers to address the emissions from the smokestack, driving up the cost of coal energy in the US relative to natural gas, nuclear, and hydropower. In doing so, the economics of coal no longer justified building new plants in the US. In addition, hydropower, which was a cheap source of power, became impossible to grow, as the environmental movement targeted dams which blocked the movement of fish along streams. Instead, incremental power demand and replacement power demand in the US was met through a combination of waste to energy plants, natural gas plants, and Green Energy in the 1990s and 2000s.
Unfortunately, the environmental movement did not figure into its calculations the massive growth in Emerging Markets. These countries looked to cheap coal power to drive their economic growth and industrialization without regard to the emissions issues they created. In doing so, Emerging Economy Emissions exploded upward, more than compensating for the drop in the US and Europe. Overall, Global CO2 Emissions grew from 25.1 billion tons in 2000 to 36.5 billion tons in 2019, the last year for which global data is available. (Please see https://ourworldindata.org/co2-emissions for year by year data.) However, this growth becomes a tale of two groups, Developed Economies and Emerging Economies. Despite the significant growth in Western economies, US CO2 Emissions fell from 6 billion tons to 5.3 billion tons over this time frame while the EU lowered its CO2 Emissions from 3.6 billion to just 3.0 billion tons. In total, Developed Economies dropped their CO2 Emissions by between 1.5 billion and 2.0 billion tons over the past 20 years, depending on how this is measured. However, Emerging Economies grew their CO2 Emissions by 13+ billion tons. China, alone, saw its CO2 Emissions rise from 3.4 billion tons to 10.2 billion tons. And India saw its CO2 Emissions rise from less than 1 billion tons to over 2.6 billion tons. Thus, Emerging Markets added more than 6x the CO2 Emissions that Developed Markets cut over the past 20 years. The following chart illustrates this issue:
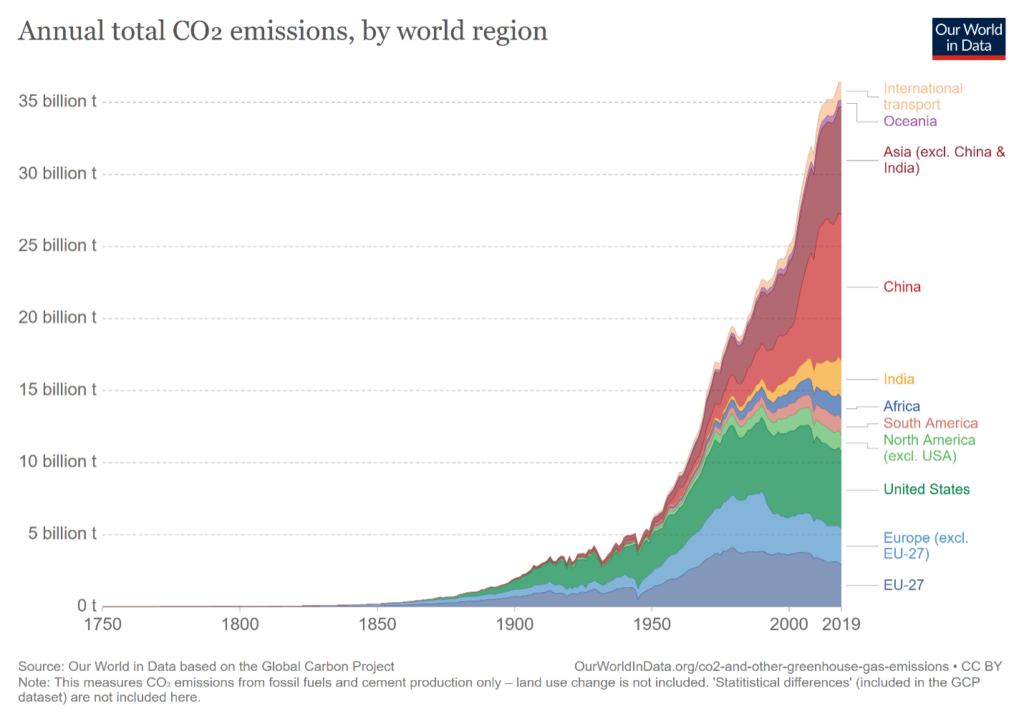
Chart courtesy of Our World In Data and can be found at https://ourworldindata.org/co2-emissions .
And with countries like China continuing to rapidly grow their CO2 Emissions, whatever Developed Economies do will end up swamped by the growth in Emerging Economies, as they emit over 60% of all CO2 globally today.
Realizing the error of their ways, the Environmental Movement refocused on CO2 Emissions over the past decade. This refocus allowed them to create a narrative that CO2 Emissions represent a threat to humanity through Global Warming and thus need to come under control and shrink. While the science appears to support the link between CO2 Concentrations in the Atmosphere and Global Temperature, the projections of the rise in Global Temperature based on this theory have vastly exceeded the actual increase. This may be due to the science behind Global Temperature variations over long periods of time which scientists theorize vary due to the Milankovitch Effect and the Ice-Albedo Effect. Other theories relate to the amount of Solar Radiation that reaches the Earth’s surface while other theories focus on variations in the surface temperature of the Sun. Whichever of these theories is correct, the following chart illustrates the Global Temperature variation over the past 500,000 years:
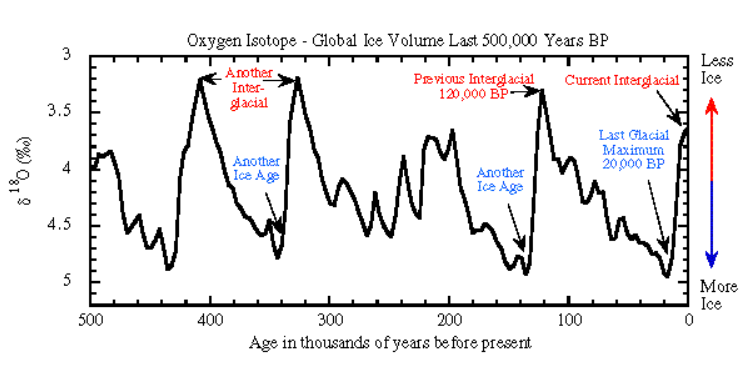
Chart courtesy of the University of Washington and can be found at https://a.atmos.washington.edu/academics/classes/2001Q1/211/Group_projects/group_D_F00/index.html .
However, when Global Temperatures are viewed on a shorter time horizon, such as the last 2,000 years, the picture looks vastly different:
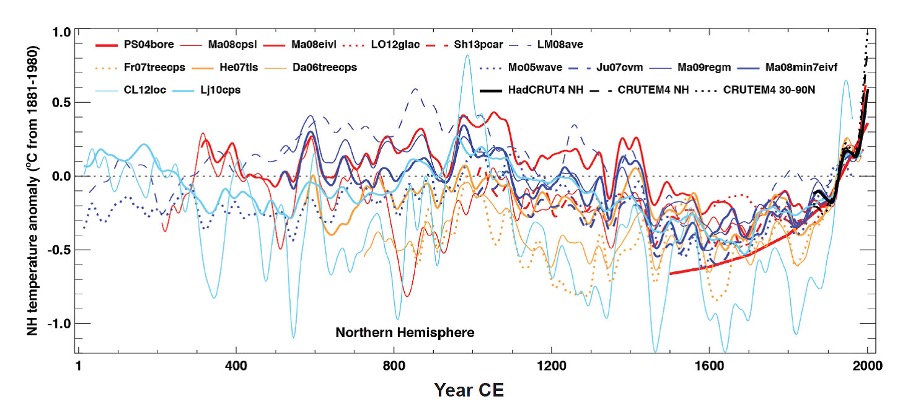
Chart courtesy of National Oceanic and Atmospheric Administration and may be found at: https://www.ncdc.noaa.gov/global-warming/last-2000-years .
The chart illustrates the Global Warming during the Middle Ages, the Mini Ice Age from 1500 – 1800, and the recent Global Warming. If we look at an even shorter time horizon, the data appears even more dramatic:
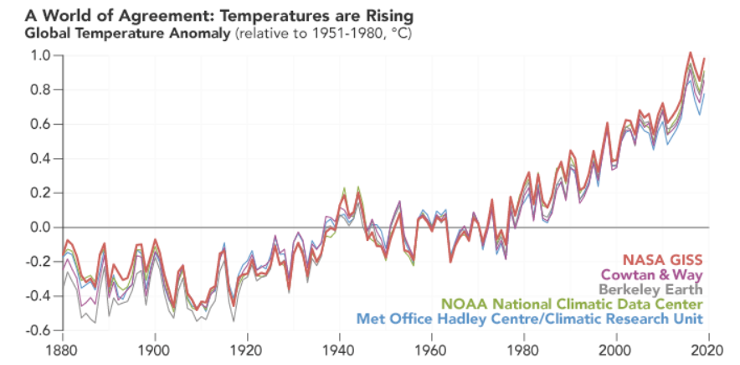
Chart courtesy of NASA and can be found at:https://earthobservatory.nasa.gov/world-of-change/global-temperatures
As these different time horizons illustrate, how one views the recent rise in Global Temperatures depends on the time horizon selected. The shorter the time horizon, the more alarming the data appear.
These differing perspectives matter little in the real world as a majority of scientists, over the past 20 years, united behind the link between CO2 Emissions and Global Warming. Thus, with the rapid rise in CO2 Concentrations in the Atmosphere correlating well with Global Warming, man made activity became the cause of Global Warming. As such, governments could alter the trajectory by reducing CO2 Emissions. Thus, the Environmental Movement focused on reducing CO2 Emissions in order to slow Global Warming and then reverse it. The solution comes in multiple flavors. These flavors vary from Solar Power to Windmills to Electric Vehicles to Hydrogen Fuel Cells. All of these various approaches will produce lower CO2 or Carbon Emissions on an ongoing basis.
However, as with all things, there exists The Law of Unintended Consequences. It turns out that all these technologies possess a commodity intensive nature. And thus, while reducing CO2 Emissions across a variety of areas, other environmental impact will occur in order to meet the primary goal. A simple example will make clear how meeting environmental goals can create serious side effects. In 1986, the Northern Spotted Owl became a focus of the Environmental Movement. In order to save the Owl, environmental organizations wanted to shut down logging on vast areas of the U.S. Pacific Northwest. The logging industry saw this as a threat to its existence and fought back hard. After 4 years of litigation and fighting at the Federal Government level, the EPA added the Northern Spotted Owl to the Endangered Species List as a Threatened Species. Under this regulation, the timber industry was required to leave 40% of any old growth forests intact within a 1.3 mile radius of any Spotted Owl nest on private land. In addition, the Federal Government shut down logging in Federal Forests. Thus, overnight, log production in the Pacific Northwest fell over 80%. While there existed softwood logs in the South, they were no substitute for the old growth mature hardwoods in Washington and Oregon. Not surprisingly, prices for logs rose significantly, by over 6 times, and continued to rise until supply elsewhere in the world could ramp up to compensate for the lack of production in the US. For consumers, wood costs rose dramatically and did not return to earth for many years. This tale stands as a reminder that Commodity Cycles possess long time horizons until Supply can catch up with Demand.
With CO2 and Carbon at the top of the environmental agenda, there exists a wholesale change in demand coming for existing raw materials and for new raw materials that must enter the supply chain to produce vehicles, whether cars for consumers or trucks for commercial use. In addition, given the significant need to recharge all these vehicles, a wholesale upgrade of the electric infrastructure must occur. And every country must build out a charging infrastructure to recharge these vehicles. If we add National Security on top of this massive change in the industrial supply chain, significant changes loom that will have a major impact on Commodities and their prices over the next 5 – 10 years.
A look at the basic Commodities of Copper and Aluminum will illustrate this issue for existing raw materials. And a brief look at lithium and cobalt will illustrate the new materials demand that is exploding. Copper is known as Dr. Copper, as it accurately reflects the state of the US and Global Economy. To bring an expansion of an existing mine into production can take anywhere from 2 – 4 years. And for a new mine, this time period can reach 6 – 8 years, given the need to delineate the ore body, obtain environmental and other government approvals, finance the mine, and then construct the mining operation. Thus, lead times are lengthy, to say the least. Given this, much of the Copper supply situation is well known for the next 5 years. And while there can be some high grading, whereby miners mine higher grade ore to produce more metal, there is a limit to this and often the life of mine plan will not enable such actions due to the layers of ore being removed. A quick look at incremental demand from EV’s explains why copper demand will explode over the next 5 years. And when juxtaposed against expected supply growth, it explains why Global Supply-Demand will likely remain tight through at least 2025 and potentially beyond, until new mine supply arrives:
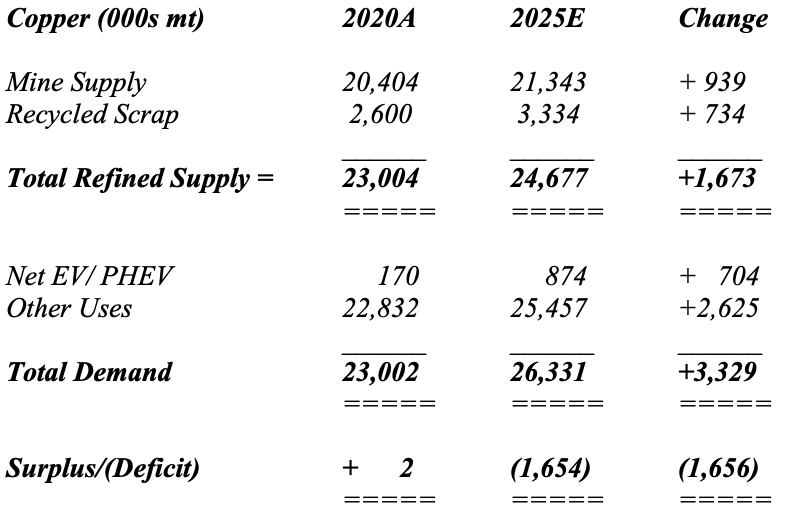
Data care of Jefferies, LLC as of February 24, 2021.
As the above table makes clear, the Copper market appears headed for significant deficit that only new mine supply can solve. Thus, prices must rise to encourage supply and to ration demand. While a recession would bring the market into temporary surplus, it would not solve the fundamental Supply-Demand imbalance. Once the recession ended, the fundamental imbalance would surface once more pushing prices higher to ration demand and to encourage the restart of mine development plans.
While most people do not think of Aluminum as directly related to Green Materials, it possesses a central role. Aluminum’s light weight and ability to recycle its products make it a metal of choice in many applications, whether EVs, Solar, beverage cans, or wind. Over 75% of all aluminum ever produced remains in use today due to the ability to recycle the metal into virgin material as aluminum sheet and into aluminum parts. And due to the use of hydropower for much of its production, aluminum qualifies as low carbon production, making it particularly suited for the “Low Carbon, Green Metal” label as part of ESG. For aluminum, the change in the relative balance of Supply and Demand appears less dramatic. Given the massive portion of supply sourced through recycling, the market remains in a slight deficit of 1% – 2% each year from 2020 to 2025. While mined supply of Bauxite will not rise significantly over the period, higher prices must occur to encourage even higher recycling of the metal, as marginal supply must come online.
For lithium, which goes into batteries for everything from laptops to phones to EVS to …, demand continues to explode. Despite rising supply from multiple sources, the current surplus is projected to become a deficit in 2024 and continue rising through decades end:
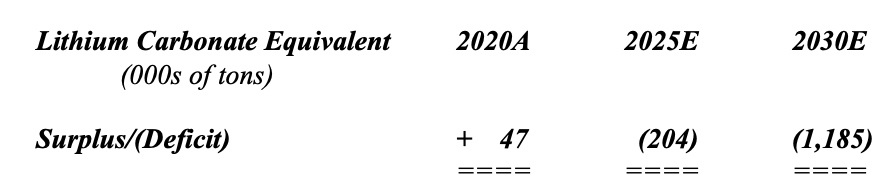
Data care of Jefferies, LLC as of December 20, 2020.
With this profile, price will need to increase to encourage new mine production, given the government mandates around the world to increase EVs as a percent of overall sales. Fortunately, lithium ore bodies coat the earth, so significant opportunities to develop new supply exist.
As the above examples illustrate, the adoption of Green Energy to combat CO2 will drive commodity demand on top of normal demand growth. This will ensure that many commodities remain in deficit over the next 5 – 10 years. As a result, prices must rise to encourage both new mine supply and lower demand to balance the markets. For consumers, this will contribute just another factor to higher prices and inflation. But for mining companies, this should produce a boom. And in this boom, the mining companies will say. “Thank You For The Green Energy Driven Boom”.
Confidential – Do not copy or distribute. The information herein is being provided in confidence and may not be reproduced or further disseminated without Green Drake Advisors, LLC’s express written permission. This document is for informational purposes only and does not constitute an offer to sell or solicitation of an offer to buy securities or investment services. The information presented above is presented in summary form and is therefore subject to numerous qualifications and further explanation. More complete information regarding the investment products and services described herein may be found in the firm’s Form ADV or by contacting Green Drake Advisors, LLC directly. The information contained in this document is the most recent available to Green Drake Advisors, LLC. However, all of the information herein is subject to change without notice. ©2020 by Green Drake Advisors, LLC. All Rights Reserved. This document is the property of Green Drake Advisors, LLC and may not be disclosed, distributed, or reproduced without the express written permission of Green Drake Advisors, LLC.