
The Bond Market Vigilantes, Part III: Inflation, Yields, & Equity Market Valuation


Views From the Stream
The Bond Market Vigilantes, Part III: Inflation, Yields,& Equity Market Valuation
As a kid, I remember my parents taking me to the beach. And discovering the wonderful properties of sandpiles. We took turns building the sandpile. And then, all of a sudden it would collapse. And when it collapsed differed every time. Sometimes, it would fall apart just as we were getting under way. Sometimes, it would grow large then spectacularly collapse. Whatever it did, I remember spending hours of fun doing this. Of course, I did not understand that the joy of watching a sandpile collapse originated in the science of Chaos Theory, Complexity Theory, and Critical States until many years later when I stumbled upon a column from John Mauldin and subsequently read the book Ubiquity: Why Catastrophes Happen by Mark Buchanan.
The great thing about this book stands the verbiage that replaces the complex mathematics. It takes the complex math and reduces it into understandable straightforward concepts. So, the simple explanation concerning a sandpile stands the following. As the sandpile forms, it possesses steeper areas, “less stable” areas, and less steep areas, “more stable areas”. Each unstable area possesses a critical state at which an avalanche would get triggered. The other key fact is as follows: as you add sand, the number of areas that are less stable grow in number. So, if you add sand and it triggers an area of instability to collapse early on, when they exist as isolated spots, the result is a small avalanche. But if the sandpile continues to grow in size the areas of instability grow and they interlink. So, when an avalanche gets triggered, it drags other areas of instability along with it following a power law. In other words, the size of the collapse grows in exponential proportions. Thus, you get a massive collapse of the sandpile, something that brought joy to my childhood self.
However, in the real world such massive collapses bear economic consequences not childhood joy, unless you are a bankruptcy attorney. Think of the collapse in Technology spending after the Dot Com Boom in the late 1990s. Think of the collapse in Housing after the 2005 – 2006 Housing Bubble. Think of the collapse in Oil Prices in the 1980s. Think of the 1987 Stock Market Crash. All of these collapses occurred over short periods of time and with large magnitudes. And they all brought pain to different sectors of the U.S. Economy.
To understand today’s instability, one needs to take a step back. Inflation continues to brew under the surface. The following chart shows the level of the CPI Index from 1913 to 2026:
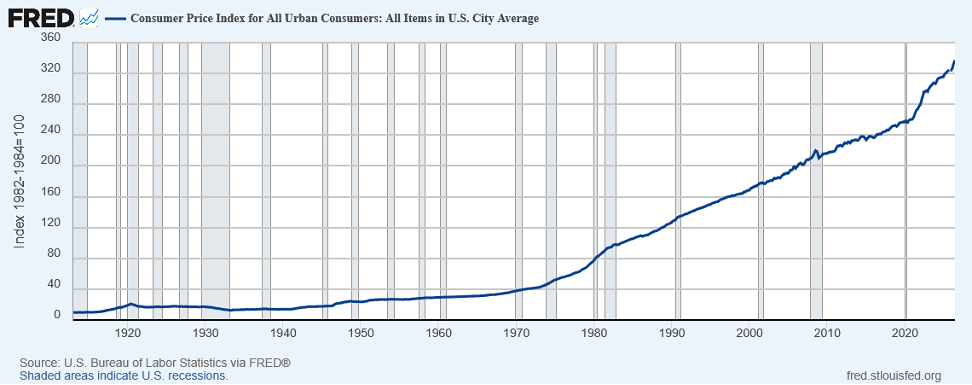
As the chart seems to indicate the CPI recently appears to have accelerated upward. The following chart looks at the Inflation Rate:
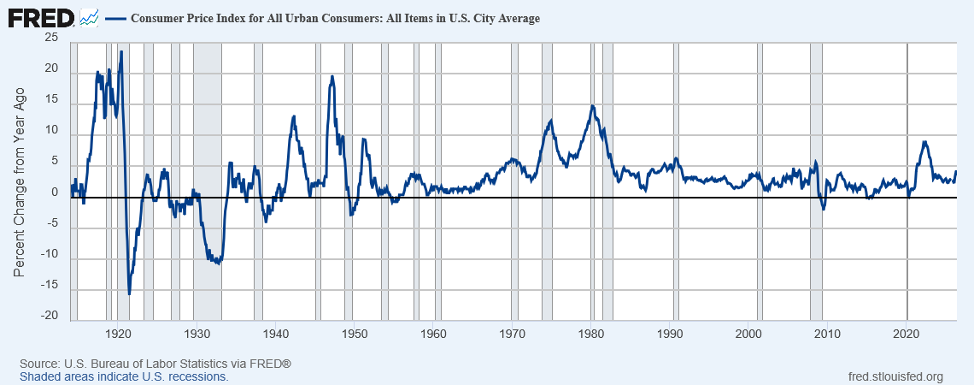
And this chart confirms that Inflation Rates moved higher since the Pandemic. Excluding the “Transitory” Period when the Fed did nothing to counteract Inflation, Inflation appears to now most closely resemble the period from 1990 to 2010, not what occurred from 2011 – 2019. While the Federal Reserve talks of a 2% Inflation Target, Inflation stands well above this level for the past 5 Years. And, this excludes statistical updates by the Bureau of Labor Statistics, which magically lowered the CPI calculated results. Else today’s number would stand even higher.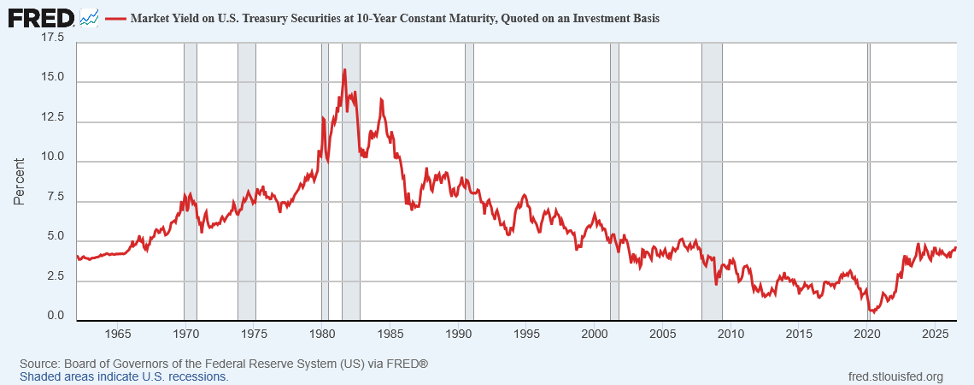
While the 30 Year Bond Yield moved above 5%, reaching 5.21% recently:
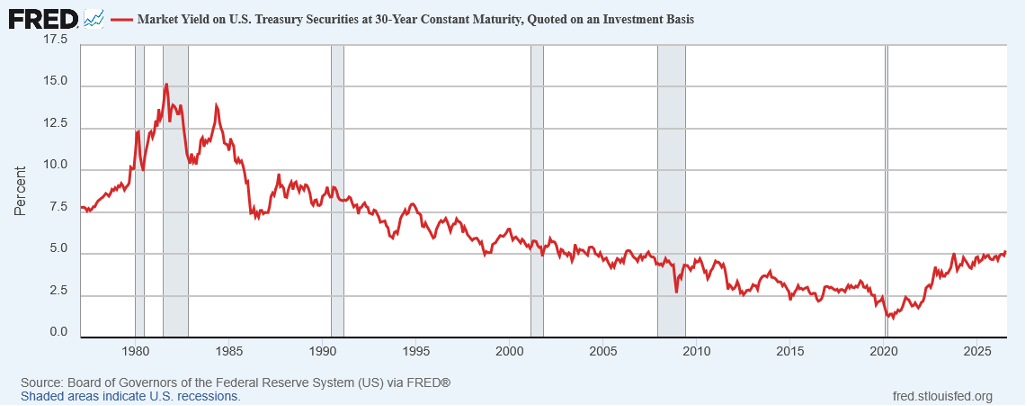
And should it return to its early 2000’s levels, the Bond Yield would reach 5.50% – 6.00% as a new normal range, potentially on the way to its 1990s level of 6.00% – 7.50%.
These changes are already creating an impact in the marketplace. Excluding certain areas of technology and the current Venture Capital backed companies related to AI and Defense, valuation for private companies declined over the past 5 Years. This came as Private Equity Funds lowered the valuations they would pay for companies in order to meet both debt service and the returns their investors expect. With higher rates and the same cash flow, buyers needed to lower their prices in order to meet debt service tests and investor expectations. (Whether these firms will meet the returns presented to investors remains a totally separate question.)
In addition to Private Equity, Real Estate stands directly impacted by higher rates. For Commercial Real Estate, Debt Service Coverage Ratios, known as DSCRs in the industry, put pressure on the multiple of cash flow buyers could pay. Thus, Cap Rates rose to reflect this, forcing cash flow multiples down. For Homeowners, home prices stalled or reversed their climb as rising interest rates squeezed the marginal buyer’s ability to afford a home. With banks running similar tests for homebuyers as commercial clients, rising rates pushed the marginal buyer to the edge as Homeowner affordability returned to levels last seen in 2005 – 2006. Should the 30 Year Treasury Bond Yield return to the 5.50% – 6.00% range, then today’s 6.65% Mortgage Rates would stand at the low end of the range based on historical spreads with Treasuries and likely would range between 6.50% and 7.50%, keeping a lid on home prices. For commercial real estate owners, such a rise would put additional pressure on asset values and the ability to refinance debt, on which much real estate economics depends.
However, there exists one area where valuations continue at high levels compared to current Interest Rates: The Equity Markets. Equity Valuations stand at extreme levels despite the normalization in interest rates. As Rober Shiller’s CAPE (Cyclically Adjusted PE) demonstrates:
With a lagged response, Financial Markets continue to adjust to this changed reality. The Bond Markets provide the most obvious place to observe this adjustment. The following chart of the U.S. Government 10 Year Bond shows rates already returned to their 2000 – 2007 levels:
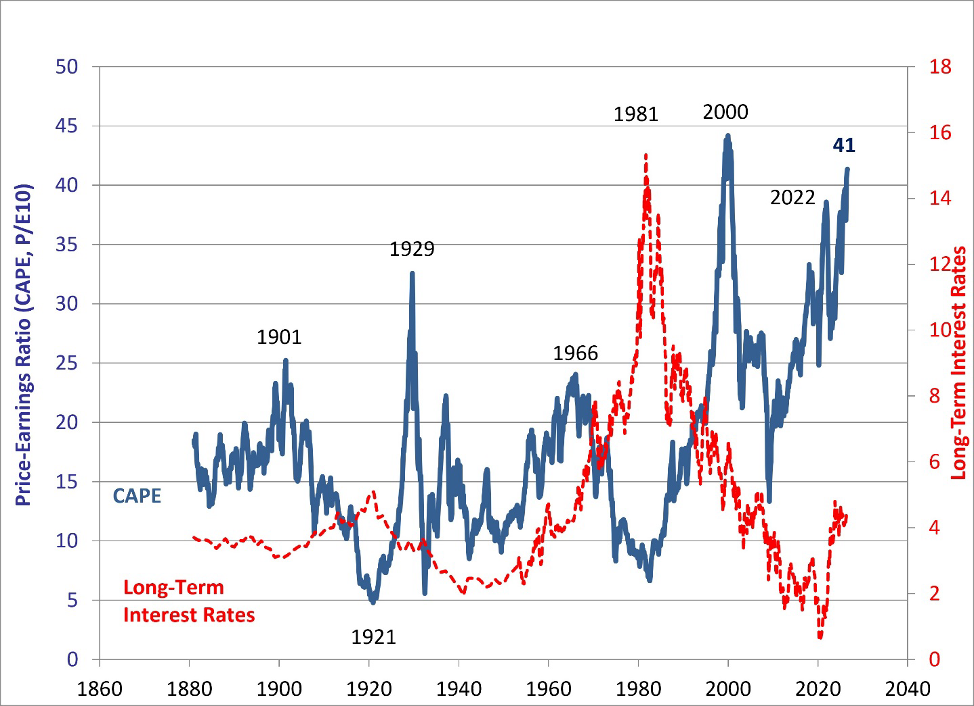
Today’s CAPE of 41 stands higher than any period except the peak of the Tech Bubble from March 1999 to August 2000. Even when measured on Current PE of 29x, this stands well above normalized levels of 20x – 21x over the long term. And in a true Bear Market, the PE can easily go to 11x – 14x, as it has on numerous occasions. During the 2008 – 2009 Bear Market, the PE went to 8x, excluding negative earnings, which matches the valuation bottoms that occurred in 1979 and 1949.
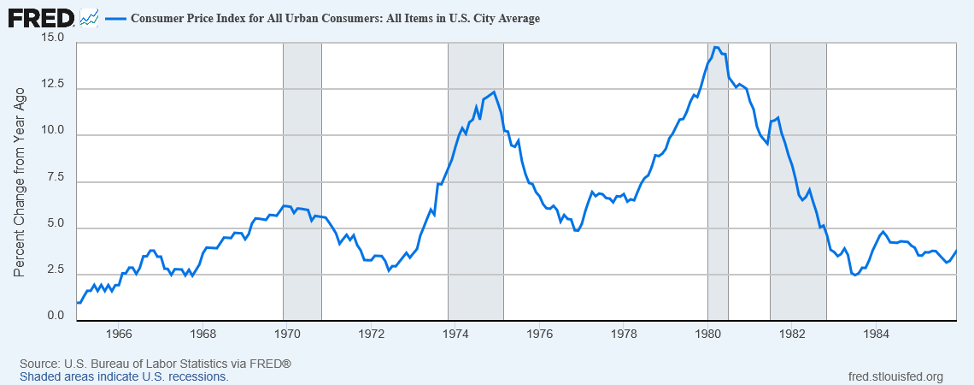
However, valuation by itself does not mean that a collapse stands ahead. There needs a trigger, much like the sandpile needs that grain of sand to set off a chain reaction of interconnected areas of instability to create those spectacular collapses. For the Markets, these typically originate in exogenous, unpredictable events or the rise in Interest Rates. As the former is random, such as 9/11, a focus on the latter provides some perspective on what could go wrong. In 1968, Inflation heated up, going from 2.50% in late 1967 to 6.00% in late 1969:
As a result, the Federal Reserve responded by raising the Fed Funds Rate from 3.50% to 9.75%, a rate well in excess of the rate of Inflation:
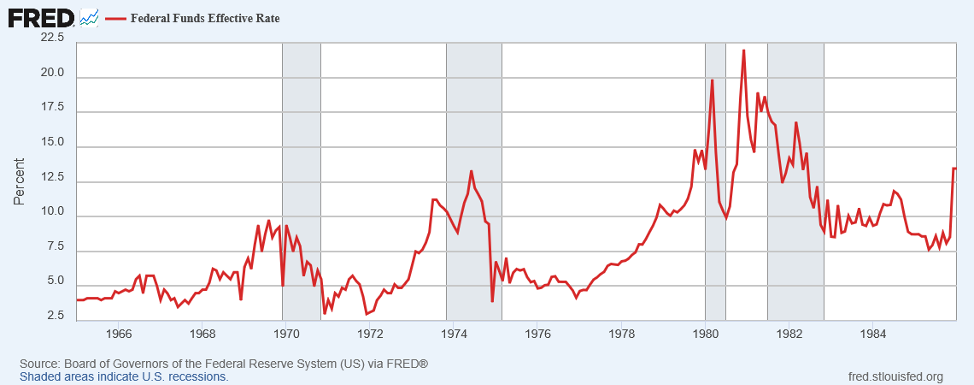
In response to a Rate Hiking Cycle by the Fed, the Equity Markets declined 36% discounting the upcoming Recession.
In mid-1972, Inflation started to heat up once more. From a low of 3.00%, Inflation rose to a peak of 12.3% in December 1974. As a result, the Fed embarked on a Rate Hiking Cycle once more. This time Fed Funds rose from 3.00% to a peak of 13.3% in June 1974. As a result, the Equity Markets entered a Bear Market with the S&P 500 ultimately falling more than 45%. And with the CPI rising over 20% those two years, the Real Bear Market equated to a 65%+ drop in value.
Sometimes, Inflation is not the trigger for higher Interest Rates. They become driven by economic growth and the demand for credit. In 1987, the economy showed strong growth and demand for financing grew significantly due to investment driven by the TRA of 1986. Equity Markets soared, rising over 20% through August. However, long term Interest Rates soared as well with the Yield on the 30 Year Treasury Bond rising from 7.50% to almost 10.00%. In October, the market crashed by over 24%, adjusting to the higher Interest Rates in just 3 Days. When subsequent economic data made clear that growth continued apace, it became clear that what occurred was a valuation adjustment in stocks, not a harbinger of economic troubles ahead. Despite the crash, the S&P 500 finished up 2% for the year.
Interest Rates stood a trigger in all these cases. Sometimes driven by the Federal Reserve. Sometimes driven by the markets. In today’s environment, with the Federal Reserve unwilling to raise Interest Rates, the markets appear set to speak. This stems from the massive Debt the U.S. Government continues to accumulate relative to GDP coupled with the massive spending on AI infrastructure in the private sector. The Federal Budget Deficit to GDP stands as follows:
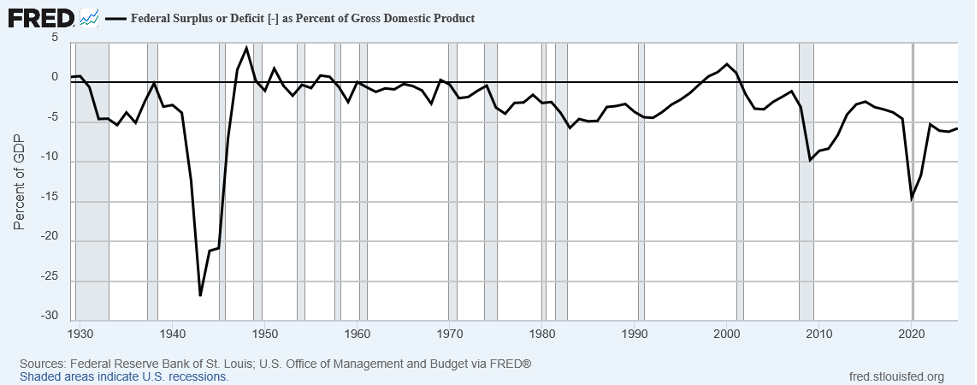
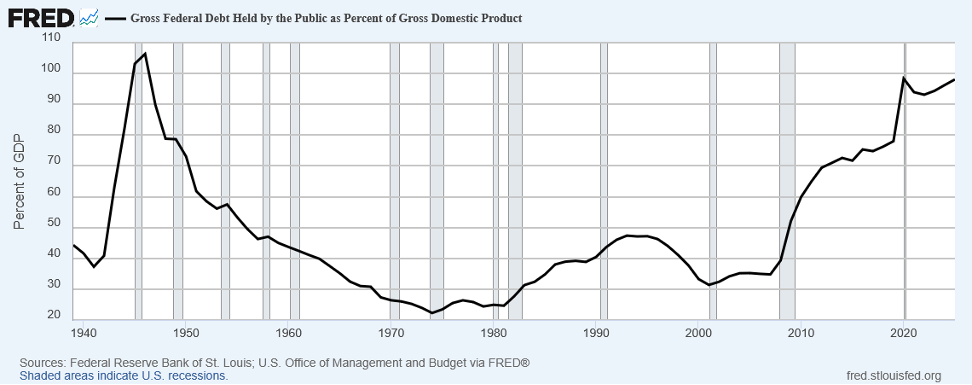
These Deficits stand the largest peacetime Budget Deficits since the Great Depression, a time when Unemployment stood at over 20% of the population. As a consequence of Congress refusing to raise taxes to pay for spending, U.S. Debt Outstanding continues to climb and Debt to GDP may reach 100% or more:
However, the danger is not just in the absolute level of debt, it stands the cost of the debt. As the Global Reserve Currency, the U.S. enjoys the privilege of printing money and managing the cost of that money. However, just as the price of Gold exploded once the Biden Administration made clear it possessed no intention of reining in spending or raising taxes, the price of Debt has begun to rise as the Trump Administration continues these policies:
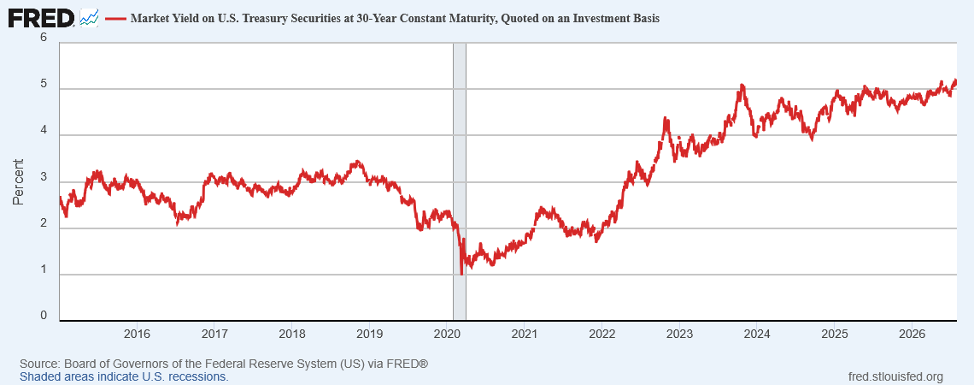
And while the Federal Reserve Chairman, Kevin Warsh, talks a good game, the markets look to the Fed to “walk the talk” and raise Interest Rates. With the Fed voting 9 – 3 at the last meeting of the FOMC to not raise rates, the Bond Markets took this as a signal the Federal Reserve would continue to avoid doing the politically difficult task of raising Interest Rates before an election. Should the Fed continue to avoid raising rates, especially post the November election, the Bond Market will take this as a signal the Fed possesses no intention of reining in Inflation. And, as a result, long term Interest Rates will continue to rise. This will put tremendous upward pressure on short term Interest Rates. The danger for the U.S. stands the following chart of U.S. Interest Costs to GDP:
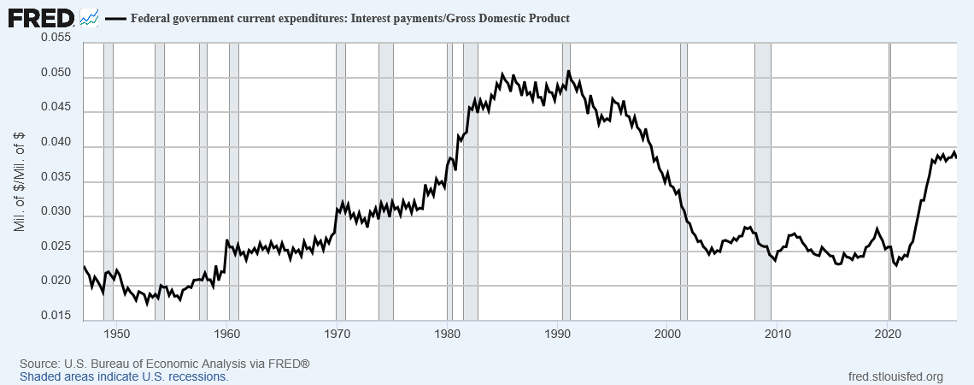
As rates rise, Interest Costs will rise which, in turn, will cause Debt Service Costs to rise. This could return U.S. Interest Payments to their 1990s peaks relative to GDP. Should this occur, the Bond Market Vigilantes will ride into town in force and come to dominate the markets. This will likely put the U.S. Government in a position where the Federal Reserve needs to raise Interest Rates and Congress must act to rein in the Budget Deficit by raising Taxes. This combined action will certainly cause a shock to the system.
For the Equity Markets, Long Term Interest Rates already stand 2.00%+ above their pre-Pandemic level and 3.50% above the Pandemic bottom in rates in 2020. As noted above, just a 2.50% rise in these Interest Rates caused the 1987 crash. And, at that time, Equity Markets stood at much lower valuations. A continued rise in Long Term Interest Rates to the 5.50% – 6.00% range would move rates to 2.50% – 3.00% above their pre-Pandemic levels. Given the Equity Valuations noted above, a return to a more normal PE would likely cause a 25% – 30% drop in Valuation. And with 30 Year Interest Rates already at 5.21%, such an outcome stands just a hop, skip, and a jump away. Given the huge move upward in the markets over the past decade and the internal stressors, such an outcome would certainly trigger an avalanche of uncertain proportions.
As I remember the sandpiles of my youth, they stand glorious examples of the randomness involved in complex systems. The longer the sandpile avoids an avalanche, the higher the probability that when one occurs it will be spectacular. However, when one moves the sandpiles to the real economy, the spectacular avalanches become real world disasters across both asset classes and the economy. While avalanches stand a random event, they stand predictable that they will occur. And for investors used to the good times, with Technology stocks leading the charge to rarified valuations, such an event will come as a shock to the system, as once started, avalanches stand unpredictable in magnitude and in the collateral damage they create. With the Bond Market Vigilantes appearing on the horizon, it remains just a matter of time until a spectacular avalanche unfolds and we get to see the sandpiles of my youth replayed in the real world with the concomitant fireworks that will erupt when they do.
Space X: An Out of This World Valuation
For those of us who lived through the late 1990s Technology Bull Market and the Dot.Com/CLEC Bubble, we remember how valuations soared for any tech related company at that time. And the IPO market proved welcoming to these companies, providing capital to fund their business plans. Of course, once the capital market spigot got shut in 2000, many of these companies floundered as they could not deliver the revenues and profits they projected. And many ran out of money needing to shut their doors.
Space Exploration Technologies Corporation, more commonly known as Space X, brings a similar valuation to that seen in the late 1990s. Space X went public at a price of $135 per share. With 13,545 million shares outstanding, this produces a valuation of $1.828 trillion. The company is expected to produce ~$41 billion in Revenue and produce Earnings Before Interest and Taxes, EBIT, of $6.7 billion and Earnings Before Interest, Taxes, and Depreciation & Amortization, EBITDA, of $19.8 billion. Based on these 2026 Estimates, the IPO price occurred at a Valuation of 44.6x Revenue, 92.3x EBITDA, and 272.8x EBIT. However, by 2030, in just 4 Years, Wall Street projects Space X to achieve Revenue of $470 billion with EBIT of more than $235 billion.
To put this into perspective, Apple will produce $480+ billion in revenue this year with estimated EBIT of $155+ billion for an Operating Profit Margin (OM) of 32% – 33%. And Microsoft will produce margins of 46% in 2026. This breaks down into 65%+ for its software related areas, but only 40% for its cloud business. On the other hand, major defense aerospace contractors such as Lockheed Martin and Raytheon Technologies have Operating Margins of 10% – 12% and 14% – 16% respectively with EBITDA Margins of 16% to 18% and 21% – 23%. So, Space X’s Operating Margins of 16.3% are comparable to a company such as Raytheon. But with an EBITDA margin close to 48%, the question becomes how much investment is needed as the company matures.
With Space X’s current 2026 Operating Profit Margin, there is clearly room to close the gap with a company like Apple. Apple is a mixed hardware and services company. So, at some level comparable based on where Space X is headed. But for US Government related launches, there probably exists little room for improvement, especially with competition coming. So, how does Wall Street get to a 50%+ Profit Margin? It assumes the Launch Business explodes upward in Revenue driven by the new Starship Rocket. Space X’s mainstay rocket, the Falcon 9, continues to perform well. And launches appear growing at a steady pace of 30 – 35 per year, getting the company to 165 launches in 2025 up from just 31 in 2021. This seems reasonable and controlled growth. In contrast, Starship launch growth explodes upward, not to make a pun. From just 40 launches in 2027, its first year of commerciality, the number of launches rises to 300 in 2028, 1,000 in 2029 and 2,250 in 2030. It then jumps to 5,000 in 2031. Of course, most of these launches will support its Starlink business. Space X plans to increase its capacity from 1.150 tbps (Terabytes Per Second) today to more than 33.000 tbps by 2030. As a result, projections show the company capturing 40% of the non-fiber broadband homes in the country. In addition, these launches will drive its AI Data Center Business in Space which will consume 82% of its Starship launches in 2030 and 96% in 2031.
While Starship appears a viable rocket, its Heat Shield appears to need new science to meet the demanding schedule of reuse that the company plans. Based on its latest flight, there occurred significant damage to the Heat Shield upon reentry, similar to what occurred with the Shuttle for the U.S. Government. This required extensive repairs to the Heat Shield between missions. Such appears the fate of Starship. Outside scientists believe a new technology needs development to address the current limitations. With no such technology in development, as far as anyone knows, the 300 planned launches in 2028 appear in danger, let alone the 1,000 in 2029 and 2,250 planned for 2030. To meet these types of flight goals, given current technology, will require many more rockets than currently planned. This would represent a major need for outside capital and change the Return on Capital equation, which depends on rapidly reusable rockets with short turnarounds.
Given the above, Space X continues to get the Elon Musk aura. However, given the reality needed to deliver the future, actually meeting those projections stands a low probability event. These projections stand similar to those for Amazon, which for many years stood forecast to make $20+ per share according to Wall Street. It appears that the company will finally achieve this in 2027, more than a decade after the original forecasts. While Space X may achieve the EBIT forecast by Wall Street today, the question stands when. Will Space X achieve this in 2031 as Wall Street forecasts today? Or will this occur in 2035 or 2040? With Elon Musk at the helm of the company, investors continue to articulate a near term victory. But with Space X possessing An Out of This World Valuation, based on 2026 and 2027 projections, the question stands when will the future become the present.
Recent & Upcoming Travel
I just returned from a Family Office Conference in Newport, Rhode Island. It brought together people from all over the country and overseas. It represented a microcosm of Family Offices from around the world with their key investments and key issues. Much of the conference revolved around private meetings that were sponsored by various people attending the conference. This gave the attendees much more intimate surroundings in which to exchange opportunities and knowledge. It also provided an opening for people to share issues that they face, whether addressing a particular investment or educating the next generation. It proved a unique and valuable opportunity to spend time with people who possess a unique vantage point. What is clear from my visit to Newport is that the hotels are full, the restaurants possessed wait lists, and the wharfs were crowded with people. A true example of the bifurcation in the economy whereby the top portion of the income distribution continues to do well, not facing the issues the bottom 50% must address on a day to day basis.
Even with the recent travel, I have had plenty of opportunity to spend time Latin Dancing, both outdoors and indoors on the weekends as the weather and my schedule allow. After almost two years of dance lessons, it appears that my skill level continues to improve. In other words, I can lead and the women can actually follow my lead. And I have discovered how some moves just flow into others enabling me to perform some unique combinations on the dance floor. I also watch in awe as some very experienced dancers make difficult moves look easy and remind me how far I have to travel. It is a fascinating experience. This time spent dancing does not mean I have forsaken pickleball. I still find time to play on a regular basis, rain or shine, as I belong to an indoor facility. And my skill continues to improve here as well. As to fishing, I am headed to the shore shortly with the thought of potentially casting a line into the ocean. You never know what you might pull out.
With that, we will report back next time on our future travels, new hobbies, and fishing tales, providing color on the happenings in the U.S. and around the globe.
Yours Truly,
Paul L. Sloate
Chief Executive Officer