The Great American Dust Bowl, Part 2: Dust Storms, Droughts, and The Brewing Water Crisis

Views From the Stream
The Great American Dust Bowl, Part 2: Dust Storms, Droughts, and The Brewing Water Crisis
A couple of months ago, I was sitting in a pub that had TVs that normally showed the live sports events. However, the time stood between the afternoon and the evening games. So, instead the pub tuned one of the channels to the news. I was struck by the video rolling across the screen. It showed a massive dust storm rolling across Montana. And it brought back memories of my childhood, when studying the 1930s Dust Bowl stood mandatory in school. With drought in the 1930s, the soil dried up and became perfect fodder for the massive winds that can occur. And when the winds came, they picked up the soil creating Dust Storms that could rise 2 Miles into the air and reach the East Coast. They resembled the haboobs that occur in places such as the Sahara Dessert. Returning to the video I watched, it seemed that the 1930s transplanted itself to today.
This storm may appear an isolated incident. However, upon investigation of the 2026 weather, this storm appears representative of a spreading number of Dust Storms across the Southwest and Midwest. Just this year, in May, Dust Storms struck South Dakota, North Dakota, and Minnesota. In April, multiple Dust Storms hit Colorado and Kansas as well as New Mexico and Texas. And, as noted above, in March, Dust Storms hit Montana and Wyoming. The source of these Dust Storms stands the Drought the United States continues to experience. This Drought appears right on time, as per historical cycles going back 12,000 years, whereby the United States experiences major Droughts every 90 – 110 Years. (For historical analysis of weather patterns, please see The Great American Dust Bowl: Food Production, Wolf-Gleissberg Cycles, and National Security published February 25, 2023.) Should 2026 mark the first year of a multi-year Drought, this would stand 95 Years after the beginning of the 1930s Drought and stand well within the normal weather cycle period.
To understand the extent of the drought that exists in the United States today, one need only look to the U.S. Drought Monitor, part of NOAA (The National Oceanic and Atmospheric Administration). The latest Drought Monitor looks as follows:
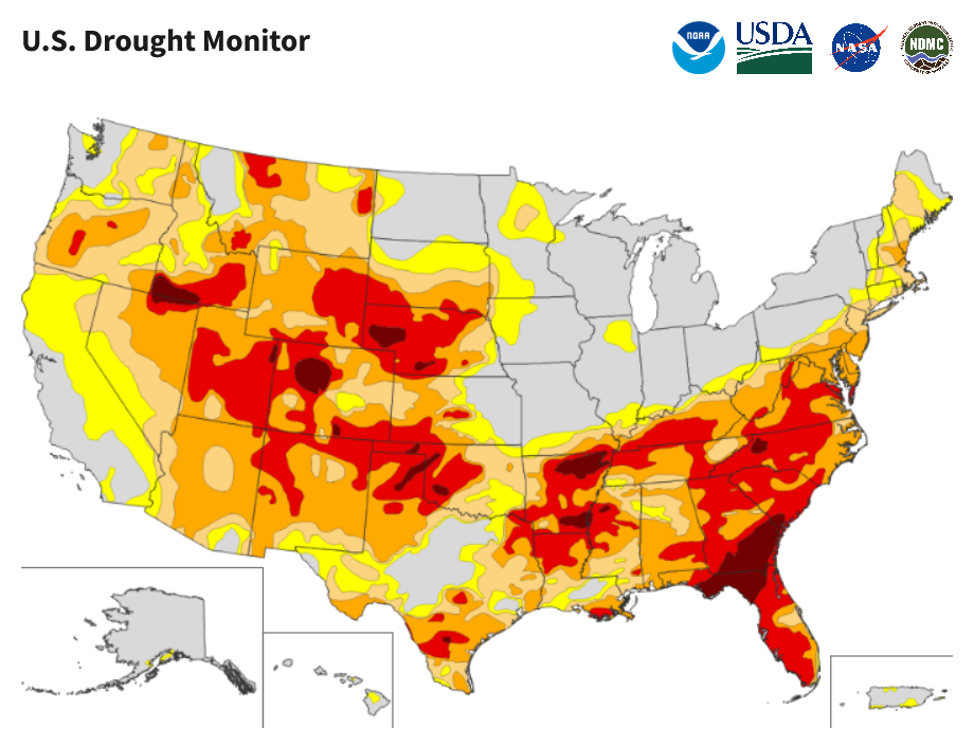
As the picture makes clear, the vast majority of the Lower 48 States stand in drought. As a percent of the land area, Drought conditions exist in 60% – 65% of the Continental US. This includes most of the West and the entire Southeast. Only the Industrial Midwest stands unscathed for now.
Exacerbating these Drought conditions stands the lack of Snow Pack across the Western U.S. As numerous skiers will know, little to no snow fell in the Rocky Mountains this year. The following graph shows the Snow Water Equivalent as a percent of the 1991 – 2020 Median Level:
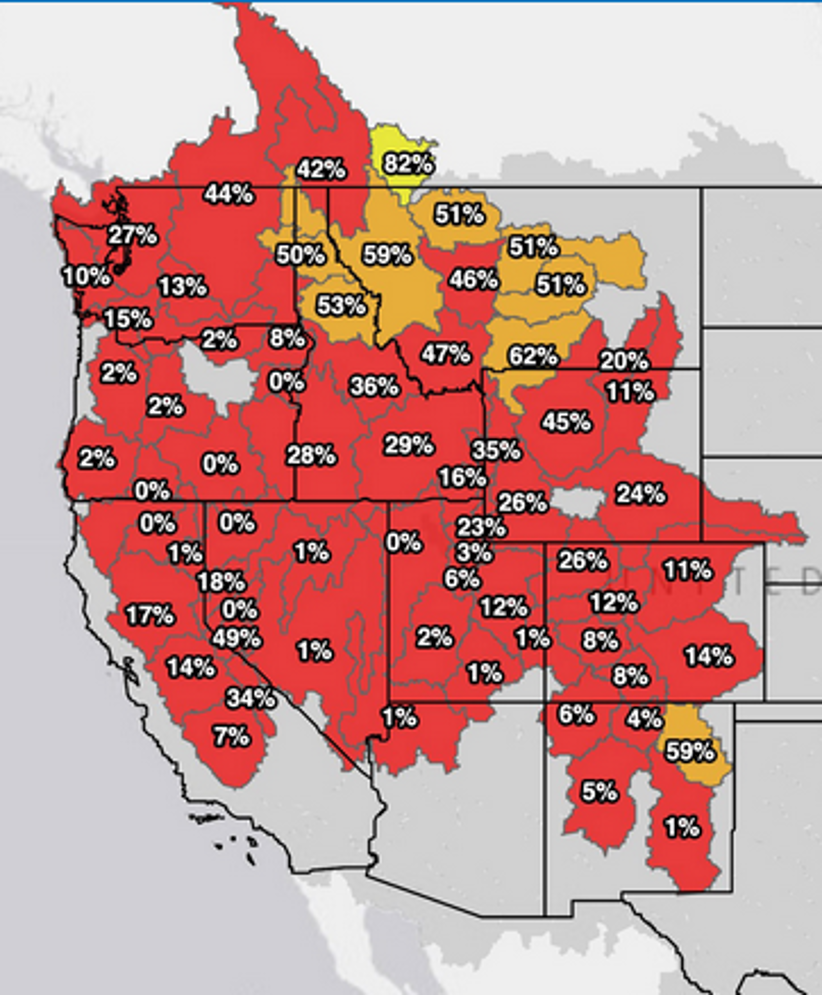
As this graphic makes clear, snowpack stands a fraction of normal. Thus, there exists little to no snowmelt to feed the streams and rivers in the region.
This would not represent an issue if the region only utilized Water at a rate that Nature could replenish. However, Water Usage and Water Rights stand at the core of economic power in the region going back hundreds of years. And, as both agriculture and industry depend on water, water usage drives economic growth. As a result, the incentive to conserve water for a non-rainy day, or non-snowy day in this case, stands low from a political standpoint. Thus, consistent over-utilization of the available water continues to occur. The Colorado River Water Basin, which services over 40 million people and over 5.5 million acres of farmland, stands in crisis. Lake Powell stands at 23.5% of its full level, having been drained over more than 20 years. After filling the reservoir during the 1960s and 1970s, the lake reached a peak of 23,348,654 acre feet of water in 1983. It held steady at above 22 million acre-feet from 1983 – 1989 before drought from 1990 – 1992 drove the amount of water down to 14.2 million acre-feet in 1992. It then recovered to 22.0 million acre-feet by 1998. Starting in 2000, the lake began to drop again. While it recovered from each of these drops, the recovery peaks stood successively lower at 15.6 million in 2011, 13.5 million in 2017, and 8.7 million in 2024. Today, Lake Powell contains only 5.9 million acre-feet of water. (Please see https://lakepowell.water-data.com/index2.php for annual data since 1963.) As one might suspect, to address the overuse of this precious resource, the Federal Bureau of Reclamation stands poised to impose water usage cuts on both upstream and downstream states that would last for at least a decade. Such cuts would force hard choices on governments that have refused to address their overuse. And it likely would force numerous businesses and farms to shutter their doors due to the lack of water availability. While a brewing El Nino could bring much needed rain to the Southwest this winter, it will not arrive in time to prevent the significant cuts proposed by the Federal Government from going into effect. And it will not necessarily end the Drought in progress, that will impact the cities, towns, and farms across the region.
With what appears to be the beginnings of a multi-year Drought, initial signs of a new Dust Bowl have begun to appear. States from Montana in the North all the way to New Mexico in the South have started to experience regular Dust Storms. And with Water Resources vastly depleted, States stand without the stockpiles needed to allay the Drought’s impact. All this leads to a Brewing Water Crisis with the potential to permanently alter the region’s economy. While Droughts end and normality returns eventually, the United States’ geologic history demonstrates numerous periods of 10 to 20 year or longer Droughts. And should Drought continue over the next several years, the coming of a Second Great American Dust Bowl appears likely. As Mark Twain once famously said, “History does not repeat itself, but it often rhymes.” And in the rhyming, the lessons of history and the implications for the present will become omnipresent in driving the future.
U.S. Government Statistics: When They Say Bad Things, Change Them, Kevin Warsh and Inflation Gauges
For those around long enough, we have observed that Governments eliminate or alter the computation of Economic Statistics that paint them in a bad light or reveal things about the economy the government would like to hide. For example, Chinese Youth Unemployment soared to over 20%, then the Government discontinued publishing the statistic for a while. When the statistic reappeared, the Government stated it corrected statistical errors in the computation and magically Youth Unemployment fell to 15%. Or, here in the good old U.S.A, the Federal Government changed the way it computed the PPI a number of years ago in order to lower the print. The Federal Reserve went from the Consumer Price Index (CPI) to the Personal Consumption Expenditures Index (PCE) and then to the Core PCE, which excludes Food and Energy. As my father used to say, the Core PCE makes sense if we all don’t eat, put gas in our cars, pay our electric bills, or heat our homes.
This brings us to the latest change proposed by Federal Reserve Chairman Kevin Warsh. According to a Wall Street Journal article (https://www.wsj.com/economy/central-banking/kevin-warsh-wants-the-fed-to-think-about-inflation-differently-64272e0a ), Chairman Warsh wants to move the Fed to a focus on the Trimmed Mean PCE excluding Food and Energy and away from the Core PCE. The Trimmed Mean PCE effectively cuts off large price movements up and down, what is known in statistical parlance as the tails. However, it does not perform this symmetrically. It excludes more price increases than price decreases. Thus, it makes Inflation a lower number than the Core PCE would otherwise state. To give a sense of this, this stands the impact of such a change. The PCE Index reported 3.8% Inflation Year over Year for April. The Core PCE Index reported 3.3% Inflation. And the Trimmed Mean PCE reported 2.3% Inflation. In other words, Chairman Warsh would like the Fed to focus on an Inflation Measure that understates actual Inflation by 1.5%. This would enable him to argue that the Federal Reserve should not raise rates and should consider lowering rates, as President Trump would like.
Should Chairman Warsh prevail and get the Fed to lower rates, this policy should provide stimulus to the economy. Inflation would stand above the Federal Reserve’s official Interest Rate, the Fed Funds Rate, turning Real Interest Rates negative. While this would accelerate economic growth, it likely would accelerate Inflation as well. In such a scenario, the Bond Market would take this as a sign the Fed planned to monetize the U.S. Government’s Debt. This would have consequences in the Bond Markets. Long Term Interest Rates would head higher, with the 10 Year and 30 Year Interest Rates breaking out to new highs. And Equity Market PE’s (Price to Earnings Ratios) would likely take a hit as multiples adjusted to rising Interest Rates. In addition, Consumers likely would initially take a hit to Real Incomes, as wages did not keep up with Inflation. This would extend and potentially increase the shrinkage in Consumer Real Incomes as occurred so far in 2026. Such a scenario likely would lead to higher wage demands, as workers sought to recover their lost income. In many ways this would create a Wage-Price Spiral, similar to the 1970s, which ended badly. As my Dad would say for those of us who eat, put gas in our cars, pay our electric bills, and heat our homes, this would stand just another example of the gap between Government Statistics and the Real World.
Recent & Upcoming Travel
A couple of quick trips to NY City reminded me how much the city recovered over the past few years. Subway trains were busy, the train station was packed, and the sidewalks filled with people. A testament to the city’s ability to bounce back from anything. This coming month there will occur a trip to Boston to attend a conference. We look forward to seeing many of those we know from across the country there and catching up with them.
As to fishing, the weather improved markedly over the past couple of weeks as things cooled off. And the recent downpours filled the streams, making for good conditions. In addition, given the drought that the area struggles under, the reservoirs started to fill up once more. All this should provide numerous opportunities to stand in a stream and cast a line.
Latin Dancing has moved outdoors. Given the cooler weather in May, the conditions proved ideal as it was neither too hot or too cold. We suspect that outdoor dancing in June will likely occur under much warmer conditions as summer takes full control. But until then, we will enjoy the current weather conditions.
With that, we will report back next time on our future travels, new hobbies, and fishing tales, providing color on the happenings in the U.S. and around the globe.
Yours Truly,

Paul L. Sloate
Chief Executive Officer