The Stock Market: Private Credit Trembles & Bubble Valuations

Views From the Stream
The Monthly Letter covers two topics this month. First, we examine the Private Credit Markets and their potential impact elsewhere. Private Credit now represents a significant piece of lending, due to Dodd Frank’s limitations on bank lending. However, it remains unregulated and serving a lower credit quality borrower. As a result, losses could mount in a recession and could have significant spillover effects on the economy and the credit markets. We also look at valuations in the Equity Markets. These valuations leave little to no room for error. Should a credit event unfold elsewhere in the economy, it could have a serious impact on the Equity Markets. Second, as always, we close with brief comments of interest to our readers on a variety of current topics relevant to the economy and the markets.
The Stock Market: Private Credit Trembles & Bubble Valuations
During the 1980s, when I started my career on Wall Street, there occurred a major debt bubble driven by low quality credit. This, of course, stood the era of Junk Bonds, Raiders, and LBOs (leveraged buyouts) and the Predators Ball. Drexel Burnham Lambert and Michael Milken, who oversaw low quality credit issuance for Drexel, vastly expanded the application of Junk Bonds during the decade. From a vehicle for low quality credits, it transformed into the vehicle of choice to back the Raiders, Greenmailers, and others who feasted on the takeover boom in the late 1980s. Those who feasted the most would get an invitation to Drexel’s signature annual event, The Predators Ball. Despite the glamor and public spectacle surrounding these deals, I remember reviewing deal after deal trying to make sense of the numbers. And eventually I concluded the deals required no industry to ever have a cyclical downturn let alone the U.S. economy to have a recession. If either of those occurred, none of the bonds I reviewed could pay the interest on the debt. And when bidding wars for companies got out of hand, which meant the cash interest payments exceeded a company’s cash flow, an even less sustainable solution occurred. Buyers would issue Junk Bonds utilizing a PIK, known as “payment in kind”. In other words, the bond claim on the enterprise would compound at 12%, 15%, or more over time instead of paying cash interest. Very few companies could grow their operating income at these rates. Thus, the debt would consume the value of the company over time. And, when a company could grow quickly, they typically stood high flying technology companies which did not fit the buy bucket for the Raiders or the LBO shops. Thus, when the 1990 – 1991 Recession occurred, the vast majority of the LBOs went bankrupt and Drexel Burnham Lambert collapsed, going out of business much as Lehman Brothers did during the 2008 – 2009 Recession and Housing Crisis.
This brings us to the present day and Private Credit. Over the past decade, Private Credit usage soared. From just 2% of Corporate Credit in 2015, it rose to $2.1 trillion today or ~14% of all Corporate Credit. While 65% – 75% is First Lien Lending, the remainder stands subordinated low credit debt. While some claim that the Banking Sector would possess little exposure to this area, as they do not lend in this manner due to regulatory constraints, this stands untrue. Non-Bank Financial Institutions (NBFIs) comprise over 15% of all loans for the Top 25 U.S. banks. Thus, the banking system entered into regulatory arbitrage. While they could not legally lend to those with low credit ratings due to Dodd Frank, they instead entered into lending to those who lent to these borrowers. When the economy is strong this does not stand an issue. But when the economy enters a recession, credit spreads tend to blow out and render assumptions about borrower payback of principal irrelevant. For those who remember companies like CIT, a classic middle market lender, this ended badly when the U.S. entered a real recession. The following chart of overall High Yield Spreads demonstrates where we are in the Credit Cycle:
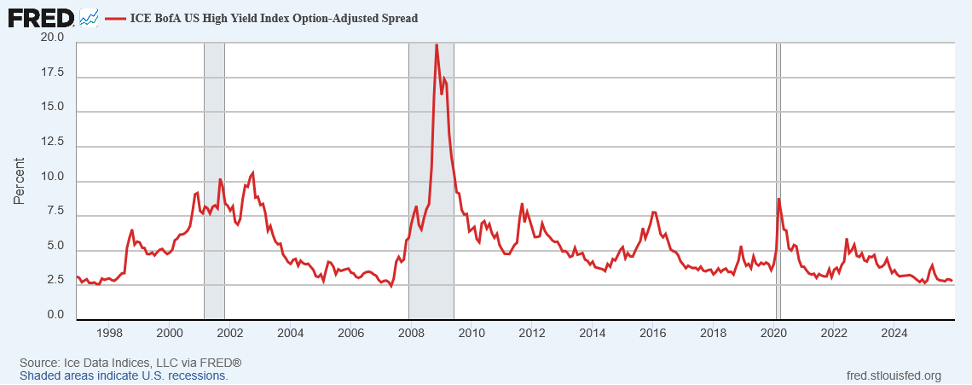
As the chart demonstrates, High Yield Spreads at ~2.8% as of December 31, 2025 stand at the lowest level since 2007, just before the Housing Crisis. If credit were to truly come under pressure, these High Yield Spreads could easily spike to 7.5%, rising 5% or more.
What the above chart does not show is the dichotomy between the upper levels of non-Investment Grade Credit and the lower tranches. For the best credits, those rated BB, which sit just below investment grade, spreads are extremely low:
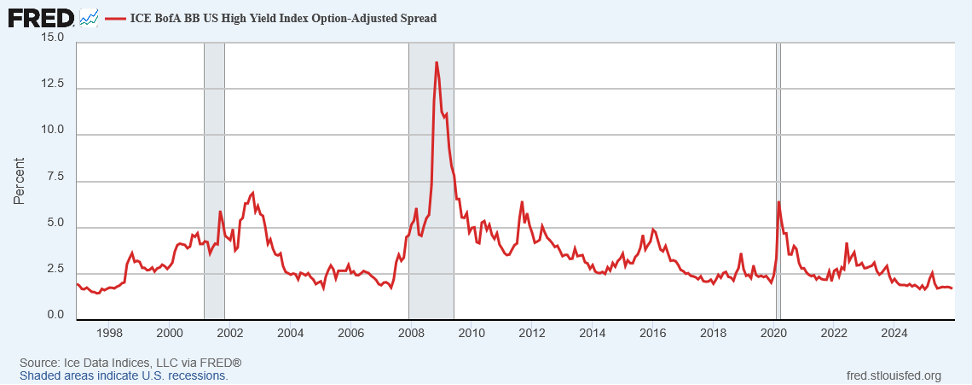
In fact, at just 1.76%, they match the lows of May 2007 and February 1998. Their upside stands much smaller, as they likely would move up to just 5% in an economic meltdown. While this would be rise of more than 3% and overall yields might go from 5.5% to 8.5%, this could move valuations down 18% – 20% potentially.
In contrast, CCC and below Spreads are not at historic lows and have begun to move up. This reflects the market beginning to demonstrate concern about the ultimate creditworthiness of these credits:

These spreads have risen from a low of 5.82% in June 2021 to 8.85% currently. And in a real recession, these spreads could easily approach 25%. With current actual yields ~12.5%, actual yields in a recession could approach 30% on these lesser credit quality vehicles, as the market discounts real default risk. As a result, these credits could decline over 50% in value. Such a decline would be devastating to the Private Credit and High Yield markets. And numerous players would go out of business. With NBFI Credit representing 15% of the loan books for major banks, such a credit event would impact these institutions significantly. It also would spread quickly through the economy, as the banking system moved to ringfence its balance sheet and private credit entities went out of business.
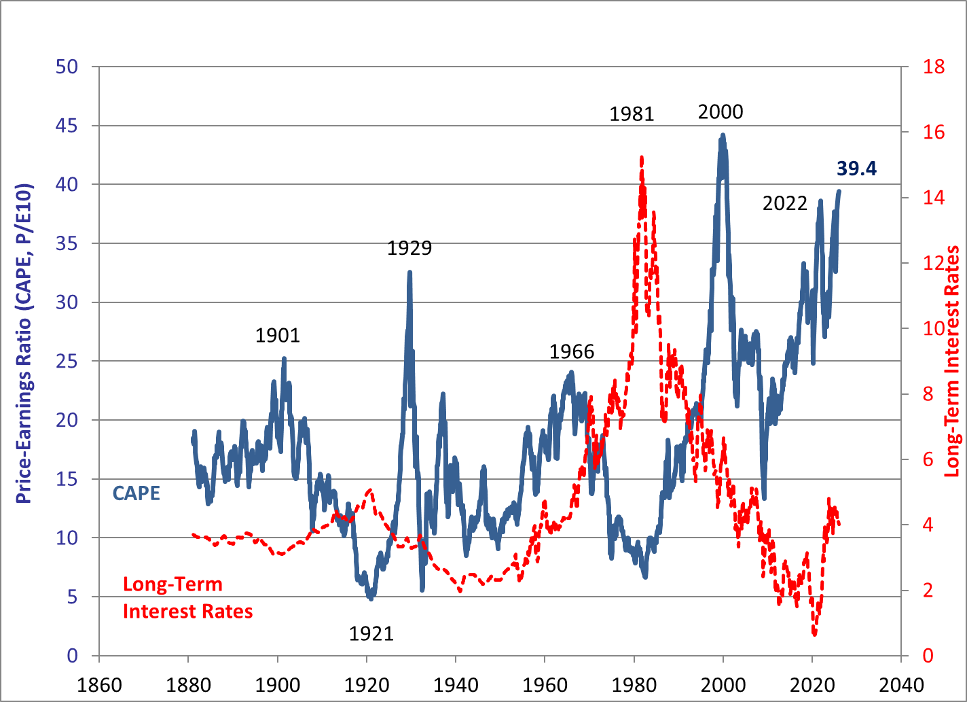
This brings to the fore the valuations in the Equity Markets. The Equity Markets’ valuation sits in rarified air. As Robert Shiller’s CAPE (Cyclically Adjusted PE) demonstrates, the valuation, at 39.4x stands above the 1929 peak valuation and the valuation peak in the 1960s. And it continues to approach the peak valuation of 43.8 reached in 2001.
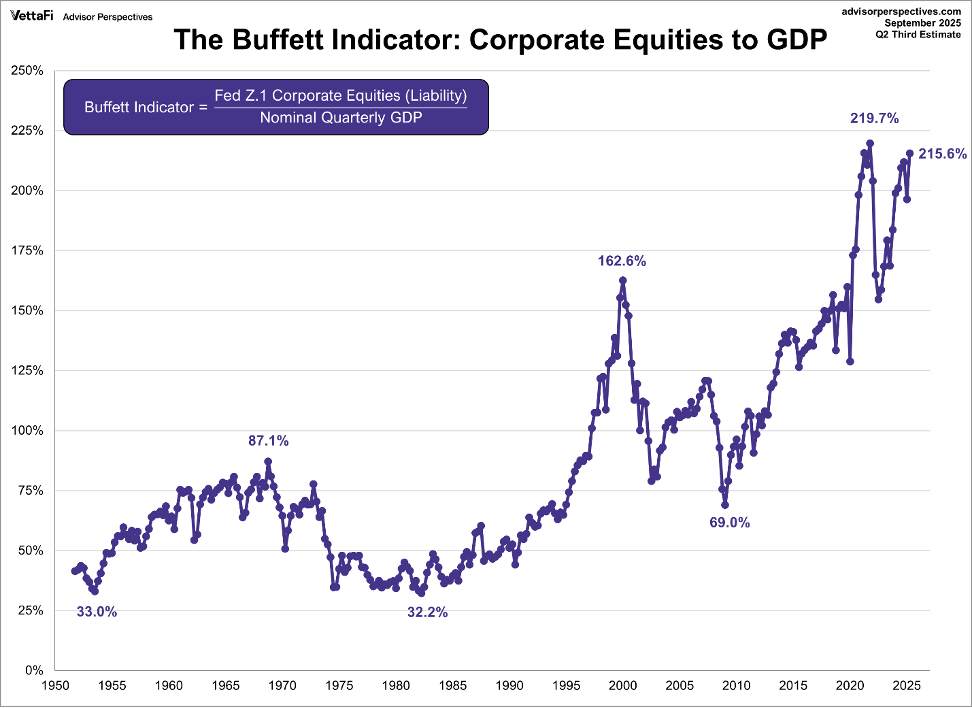
While one might argue this stands but one indicator, other valuation indicators show similar results. The Buffet Indicator, which looks at the ratio of Corporate Equities to GDP stands at levels approaching the record highs of 2021:
And if one wants a more economically based indicator than Buffet’s simple back of the envelope calculation, one can look at Tobin’s Q. This indicator looks at the value of Corporate Equities in the public markets relative to the replacement value of their assets. Based on this indicator, stocks stand just as expensive as the Buffet Indicator or Robert Shiller’s CAPE:
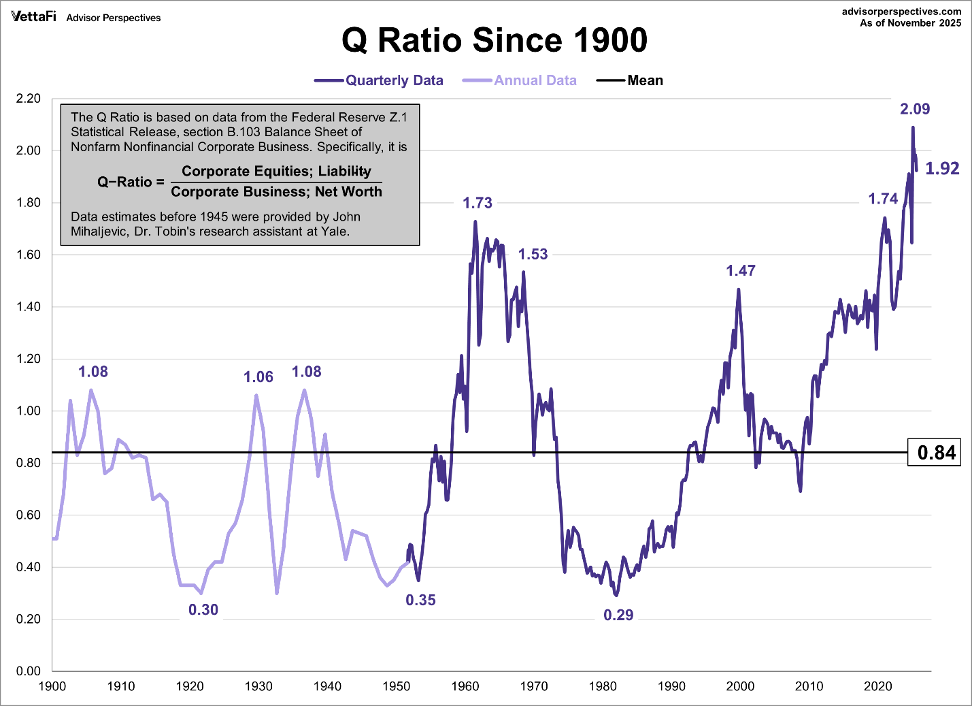
With valuations at these levels, there exists little to no Margin of Safety as Benjamin Graham would say. And if one wants to understand why Warren Buffet continues to add to his cash pile, the above charts provide a simple explanation. Despite this, according to the Wall Street Journal, strategists stand universally bullish on the Equity Markets. (See Wall Street Expects The Market To Keep Rallying in 2026 Despite Lofty Valuations at https://www.wsj.com/finance/stocks/wall-street-expects-the-market-to-keep-rallying-in-2026-despite-lofty-valuations-06ce7951 .) This universal bullishness seems curious given the Bubble Valuations in the Equity Markets.
Suppose, despite the Federal Reserve cutting rates, economic growth slows for some reason. And, as a result, margins come under pressure for private companies dependent on Private Credit. Should something like this occur, credit spreads would begin to widen. And loss rates might begin to tick upward. In addition, the Federal Reserve might begin to tighten credit standards for banks, forcing them to cut back on some of their NBFI exposure and tighten credit generally. While Equity Markets could ignore this short term, should spreads continue to widen, the markets would face the prospect of decelerating growth impacting future earnings. And with no valuation support, the Equity Markets could undergo a sharp correction.
While no one can forecast the next correction, the Private Credit Trembles in the first half of 2025 caused significant consternation. And while limited in scope, they certainly indicate a flashing yellow when it comes to High Yield Credit given the current spreads and their history over the past 30 years. Just a reversion to the mean, discounting normal credit losses, would put a significant dent in Private Credit valuations and returns, let alone a real recession. For Equity Markets with Bubble Valuations, Private Credit trembles could create all kinds of issues. And this exists outside of the real potential for rates to rise as markets discount the U.S. Government monetizing its debt through money printing. Were this to occur, inflation would accelerate, forcing up long term Treasury rates and credit spreads. Given current Equity Valuations, such interest rate moves could prove problematic for the Equity Markets as well. However one wishes to view the possibilities, risk stands high relative to returns for both Private Credit and Equity Markets. And for investors, the universal bullishness of Wall Street strategists should get taken as a contrary indicator. As Warren Buffet once famously said, “Be fearful when others are greedy and be greedy when others are fearful.” Equity Investors might want to pay attention to the fine print disclaimer on all those financial communications: “Past performance is no indication of future performance.” And they should remember the famous dictum when investing in any asset: “Caveat Emptor”, buyer beware.
Spaghetti Al Dente, Copper Shock, & Fracking Squeeze
Finally, we close with brief comments on Spaghetti Al Dente, Copper Connections, and Fracking Squeeze. First, spaghetti represents an important staple for a large portion of the U.S. population. However, the Trump Administration proposed tariffs of over 70% for much of the imports from Italy. With the Administration concerned about rising food costs on the average voter and the bite this could take in November elections, they dialed back their tariffs to 2% – 14%. With the Spaghetti Tariffs dialed back, we see them cooked like Spaghetti Al Dente. Second, the cost to build a copper mine has risen by 50% since 2020, from $20,000 per ton to $30,000 per ton. This stands against a market expected to remain in deficit for the rest of the decade. With rising copper demand across significant areas of the economy and the need for new mines, we see Copper Shock from prices continuing despite substitution, where possible, and increased recycling. And Third, oil and gas producers in the core basins using Fracking have begun to experience Productivity Declines. Midland and Delaware basin operators experienced a 6% decline in productivity in 2025. In other words, they needed to drill longer wells to achieve the same level of production out of each well. Of course, this costs more to do at the same time as oil prices have declined. As a result, we see a Fracking Squeeze ahead.
In Closing
Should you have any questions on how the above issues or the items discussed in our accompanying cover letter impact your family’s financial position or your business’s future as well as the potential actions you could take in response, please do not hesitate to contact us. We welcome the opportunity to discuss this with you.
Yours Truly,
Paul L. Sloate
Chief Executive Officer