Global Economic Quarterly, Part 2: China’s Vanishing Debt and Hidden Stimulus, U.S. Tariffs and Industrial Policy & Global Growth Rebalancing

Views From the Stream
The Monthly Letter covers two topics this month. First, we provide Part 2 of our Global Economic Quarterly. China continues to report 5%+ economic growth for its economy. However, data on the ground coupled with a collapse in the housing markets make these pronouncements just that, pronouncements not a reflection of economic reality. In addition, a Global Market Share grab continues to play out with countries seeking to advantage themselves at the expense of other countries. While the U.S. only began to respond over the past 8 years, this response will likely accelerate as the decade progresses. Such a response will have significant implication for the Global Economy and Supply Chains. Second, as always, we close with brief comments of interest to our readers on a variety of current topics relevant to the economy and the markets.
Global Economic Quarterly, Part 2:
China’s Vanishing Debt and Hidden Stimulus, U.S. Tariffs and Industrial Policy & Global Growth Rebalancing
For the Globe, there appear two opposing forces engaged in a tug of war. On the one side stands China, with fundamental issues including a massive housing oversupply, population shrinkage, and overcapacity. On the other side stands the US with a housing shortage, growing population, and undercapacity. Add a touch of Geopolitics to the mix and voila, there exists the potential for instability and rising tensions. And with China taking the view that more capacity to drive higher exports will solve its economic problems, clashes between China and the rest of the Globe stand an inevitable consequence. And with the US getting serious about reshoring production and addressing transshipment, the outlook for China continues to dim. For China, the alternative appears shrinkage of its economy that fundamentally addresses the massive overcapacity and empty real estate. Given this reality, the country sits between a rock and a hard place.
For the U.S., Tariffs and Industrial Policy hark back to an earlier era, the Cold War. During this period, there existed no question that the U.S. needed to maintain it is industrial base and its national defense. With the U.S. having underinvested in these areas from 2000 – 2020, it stands in the same position as Europe in 1946. Europe rebuilt its factories, from the rubble of World War II, driving economic growth from rebuilding its industry and economy. And given it possessed the most modern factories in the world after this investment, Europe started to gain Global Market Share from the U.S. and other countries around the Globe. Should the U.S. go down this path, it will possess the most modern factories in the world. Couple this with addressing the massive overvaluation of the U.S. Dollar, there exist the seeds for domestic manufacturing to recapture massive share both in the U.S. and around the Globe. This will upend many assumptions about how the Global Economy functions, but will stand consistent with fundamental tenants of economics as laid out over the past 300 years in works such as Adam Smith’s Wealth of Nations and John Maynard Keynes’s The General Theory of Employment, Interest, and Money. As laid out this month in the accompanying piece, Currency Wars, Part VII: Competition, Devaluations, & The U.S. Response, this will send tremors throughout the Global Economy, creating economic earthquakes ranging from 4.0 to 9.5 on the Richter Scale across the Globe. For companies and investors, the future will look starkly different than the past 30 years.
Dragon Debt Restructuring and Reckoning
For those who missed it, the Chinese Central Government just assumed somewhere between R1.5 – R2.0 trillion in Local Government Debt. In US Dollars, this stands somewhere between $200 billion and $275 billion in debt or 1.0% – 1.5% of China’s GDP. This will allow local governments to pay outstanding wages and bills. When people don’t get paid and can’t afford food or housing, it creates certain social problems. This stands in addition to the $300 billion it put in place to bail out bad housing projects, representing another 1.6% of GDP. And the $300+ billion it allocated to grow overall investment, which accelerated Manufacturing Fixed Asset Investment to 9.3% Year Over Year in the latest data. While the country still reports economic growth of 5%+, the reality probably stands somewhere in the 2% to 3% range. With Housing production down 75% from its peak in 2021 and housing prices down 40%, this seems a reasonable number as Housing represented 25% of the economy, directly and indirectly, at its peak. Housing appears to have formed some sort of bottom, as prices stabilized over the past few months and secondary market transactions rose. Whether this stands a function of government subsidies or fundamentals will only become known when the government removes the supports it put in place.
However, the industrial side of the economy along with Gross Fixed Capital Formation stands in a similar place to Housing in 2021. Massive overcapacity exists across China in multiple industries. But Investment continues to rise at a rapid pace to maintain the country’s growth rate. And, with domestic markets unable to absorb the massive output growth, China resorted to exports to solve the equation. China’s trade surplus, which stood $150 – $200 billion from 2010 to 2014, exploded upward to over $500 billion by 2016. With Donald Trump coming to power in 2017, it dropped back to $300 – $350 billion, still twice the level prior to 2015. Then, from 2021 through 2024, China embarked on a huge export surge to prevent its economy from collapsing. The current run rate of its Trade Surplus stands at almost $1 trillion. (The actual trailing 12 month surplus as of November 30, 2024 stood $957 billion.) China’s exports now represent almost 19.7% of GDP. With imports somewhere around 14% of GDP, China ran a Trade Surplus of over 5.5% of GDP in 2024. With China viewing foreign markets as the solution to its domestic problems, countries around the world have begun to shut off Chinese goods. A simple example will illustrate the type of expansion in Chinese Capacity that possesses the potential to create massive overcapacity for the country and increasing levels of economic conflict globally. The example here stands Ethylene, one of the basic building block plastics in manufacturing:
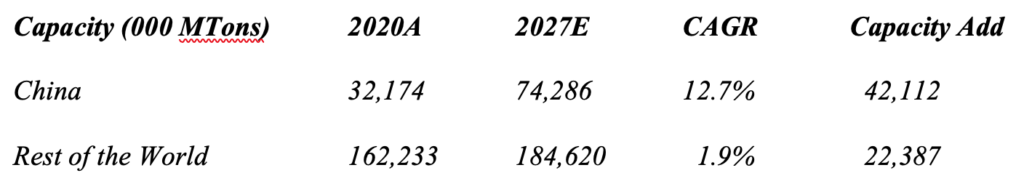
Simply put, China will more than double its Ethylene Capacity over this time frame, adding almost twice as much Capacity as the rest of the world combined. This Ethylene Capacity clearly cannot find sufficient domestic demand with manufacturers that produce goods just for the Chinese economy. Thus, the Ethylene producers will need to target exports to foreign countries and/or to target domestic manufacturers that produce goods headed for export markets. As more and more countries simply say No, this will create massive internal problems for the country’s growth. China’s industrial sector could face the same kind of pressure as its Housing faced over the past several years. At 35%+ of GDP, the impact could stand larger. For China, a Reckoning stands ahead as it reconciles its output to what the country can consume and what the world stands willing to take.
The Sun Shines As The Yen Sinks
For those living on a remote island without any financial news, they may have missed the massive depreciation of the Japanese Yen. But, if you live in any economy affected by trade, it stands one of the seminal events of the past decade. In one fell swoop, executed over 18 months in 2021 and 2022, Japan dropped the value of the Yen by over 30%, making their economy globally competitive and undoing the competitive advantage gained by their Asian competitors who depreciated their currencies over a deacde. This brought the Average Monthly Earnings to just $2,240 for a Japanese worker as of October 2024, compared to $3,400+ prior to the devaluation. This puts Japanese wages at less than half of the US, at $4,660, and Germany, at $4,495. And, to no one’s surprise, the industrial economy in Japan boomed over the past two years and the stock market rocketed upward. In addition, with a cheap Yen, tourism exploded with Tourist Arrivals now ~20% above pre-Pandemic levels. For Japan truly, The Sun Shines As The Yen Sinks.
Tiger Blackmail
For those that want to understand the success of the Asian Tigers in the current environment, it stands part protectionism, part industrialization, and part global market share grab. Each country continues to focus on its natural competitive advantage. And where that does not work, they enact programs to support industry, such as Malaysia’s 2030 Factory of the Future Plan. However, it appears a new tool now applies. Or, one could say, this tool, borrowed from China, bears the name of Blackmail. In it, a country threatens to ban a company’s products unless they manufacture the product in that particular country. In this particular case, Indonesia banned the import of Apple iPhones unless Apple began to meet local content requirements. While initially Apple appeased the government with a $1 billion Air Tag manufacturing plant that would have produced 20% of global supply, the government reneged on that agreement. It demanded instead that Apple manufacture a significant portion of the iPhone in Indonesia. And it appears that Apple agreed to do so rather than lose access to the local market. (Please see: https://www.bloomberg.com/news/articles/2025-01-22/apple-close-to-deal-to-lift-indonesian-iphone-ban-minister-says . ) While this may keep the local economy growing, as Indonesia follows the Chinese path of industrialization, it accelerates the fracturing of global supply chains. For if Apple conceded to Indonesia with a population of 277.5 million, what happens when a country like Pakistan, with a population of 241.5 million, or Nigeria, with a population of 224 million, moves down the same path? And, of course, what happens if the U.S. decides that technology products need to be manufactured in country? For multi-national companies, this will pose a dilemma. And for Asia, it might spell the beginning of the end as a global manufacturing hub. In the meantime, Tiger Blackmail will continue as one of the economic pillars to ensure these economies continued rapid growth.
Elephant Cash Handouts
While India possesses some of the best long term Global Growth fundamentals, economic growth does not move in a linear fashion. Private sector growth slowed significantly over the past year due to a slowdown in profit growth. At the same time, Government spending accelerated to offset this slowdown. According to the latest data, private sector manufacturing profit growth slowed to just 3.5% year over year. At the same time, infrastructure spending by the government continues apace, supporting manufacturing. Housing, as noted multiple times over the past few years, stands in the midst of a multi-year upturn that should continue for much of the rest of the decade.
Over the recent past, the BJP Government received a little less of the vote overall than in prior elections. However, controlling the purse often possesses a magic that can turn the tide. To ensure its victory in the important Maharashtra state elections, the government embarked on a subsidy scheme where it provided cash handouts to women between the ages of 21 and 65. The size of this payment managed to total Rs 460 billion (~US$5.3 billion) or 1.1% of the state’s GDP. To understand the size of this payment relative to people’s income, the easiest analogy would be to examine a US state like California. California’s 2024 GDP stands ~$4.1 trillion. This would mean that California would give out $45 billion in cash to its population focused on the lower income cohort. With 41 million people and 7.3 million below the poverty line, this would stand equivalent to providing a cash handout of $5,600 per person considered in need below the poverty level. With a couples poverty level at $19,720 and a family of four at $30,000 in 2024, this would represent more than 28% of a couple’s income and almost 19% of a family’s income. Such largesse might buy votes. And to no surprise, it did in Maharashtra state, with the BJP and its allies capturing 235 of 288 seats in the local state election. With such largesse buying votes in a very old fashioned way and only 14 of 28 states possessing such programs, it appears Elephant Cash Handouts will continue to grow.
The Beat Is On
For Latin America, a change seems afoot. Argentina, which lagged the rest of the Continent for the past decade appears to stand on the cusp of returning to fundamental economic growth. This would complement Brazil, where life seems good. Despite political turmoil, Bazil posted GDP Growth of 3.5% in 2024. This stood driven by large government spending and deficits. With inflation accelerating, the Central Bank embarked on a tightening program. Despite the tightening, the country appears set for another year of respectable, but slower growth in 2025 or 2.5% – 3.0% with the Central Bank likely to continue tightening through Q1 and then ease in late 2025 and 2026, accelerating growth in 2026. It also does not hurt that the value of the Brazilian Real declined from ~$0.32 in 2018 to just $0.17 recently, making its industry extremely competitive globally, especially with the economies in Asia.
Argentina, after years of failed economic policies, went down the path of dollarization of its economy to break the back of hyperinflation. This shock treatment from the Miele Administration seems to have proven popular despite its short term economic costs. Under the new economic program, inflation fell from over 25% per month, totaling over 300% per year, to 2.5% per month, or just ~30% per year. While still high, for the economy, this represents a sea change. And the economy began to respond to this shock treatment. And while GDP technically fell 2.4% in 2024, it stands 5.3% above its bottom in April 2024. In addition, the drop in GDP stood driven by the contraction in the government’s deficit, which stood at 4.4% of GDP, to a surplus of 0.3% of GDP in 2024. This stands in stark contrast to the path chosen in Brazil. If this 4.7% drag on the economy stood removed, it means the private economy grew 2.3% in 2024. In addition, Milei eliminated the dreaded Piqueteros. These middlemen controlled to whom government subsidies and benefits got paid, thus wielding huge economic and political power. These agents also siphoned off sums for themselves and forced recipients to participate in various activities in order to receive the benefits. With the government eliminating the Piqueteros, payments rose to the average recipient and the blackmail these agents could extract disappeared. For Milei, this one move provide him huge popularity against the promise of short term pain to create long term gains. Reflecting progress the government plans to take the official monthly devaluation against the US Dollar to just 1% per month from its current 2% per month. This should further slow inflation and boost the Milei Government’s standing with the people.
The Old Man Looks Inward
For Europe, the French saying, La Plus Ca Change, La Plus Ca Meme Chose (the more things change, the more they remain the same) continues to dominate the narrative. After hitching its economy to selling capital goods to China for its industrial economy, it appears China finally targeted these industries, moving to replace the goods it imports with goods it manufactures. And China also targeted the European car industry as ripe for the picking with a slew of auto exports against which Europe needed to impose tariffs. For Germany, with its export oriented economy, this produced an existential crisis, further impacted by the loss of cheap Russian gas to provide cheap power to drive its industry. Western Europe’s GDP grew only 0.7% in 2024 and just 0.8% in 2023. This compares to the U.S. Economy which grew 2.8% in 2024 and 2.9% in 2023.
In addition, the EU faces critical internal issues related to the need for Germany and France to effectively subsidize the Italian economy and take on the debt of Italy in order for the EU to remain intact. This stands on top of its push for Green Energy to replace coal and other cheap sources of power, making its industry less competitive globally. Thus, the populace began to register its displeasure with the prevailing political powers that business as usual cannot continue. Thus, the rise of the right wing parties across the Continent. While the major parties refuse to deal with them, unless forced, their continued rise could pose a significant challenge to the current order and how governments manage economic policy. With a decade of poor growth as their signature accomplishment, The Old Man likely will Look Inward at the current major policy thrusts and the changes needed to restore its economy to some semblance of growth similar to that of the 1990s.
The New Climb: Back to the Future
For the U.S., the economy continues to move in predictable ways if one returns to the 1990s. With interest rates back to their pre-2008 levels or even pre-2000 levels, various parts of the economy began to respond to a normalized Cost of Capital. Housing stands the obvious one, as it possesses some of the highest sensitivity to rates. Mortgage Rates now stand at levels last seen in the 1990s:
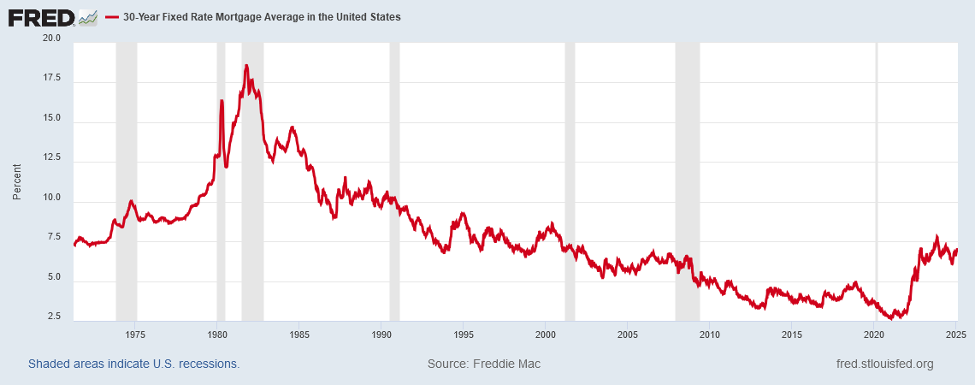
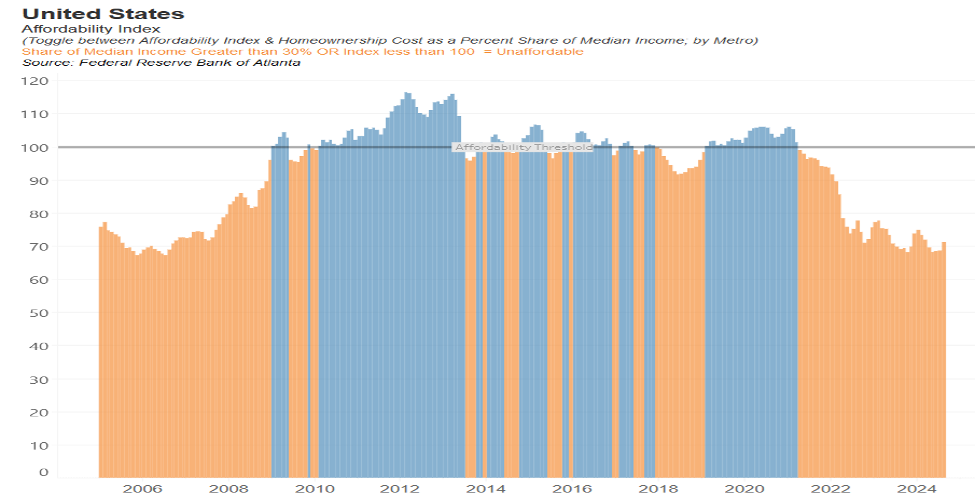
With mortgage rates having traversed a quick path from the lowest rates since the 1950s, at below 3%, to levels reminiscent of the 1990s, at 6.50% to 7.50%, in just two short years, this represents a shock to the system. The 3%+ rise in mortgage rates took Home Buying from the realm of Affordability to the most Unaffordable since 2006:
And this shock shows in the collapse in Existing Home Sales:

As the data show, Existing Home Sales now stand at levels last seen at the depths of the Housing Crisis. And with the slowdown in turnover, Months of Housing Inventory have started to normalize and return to their pre-Pandemic level. In addition, as one might expect, Single Family Homes Under Construction dropped over 25% from their prior peak level that coincided with the Federal Reserve’s Quantitative Easing Policy that drove long term interest rates down and short term rates to 0%:

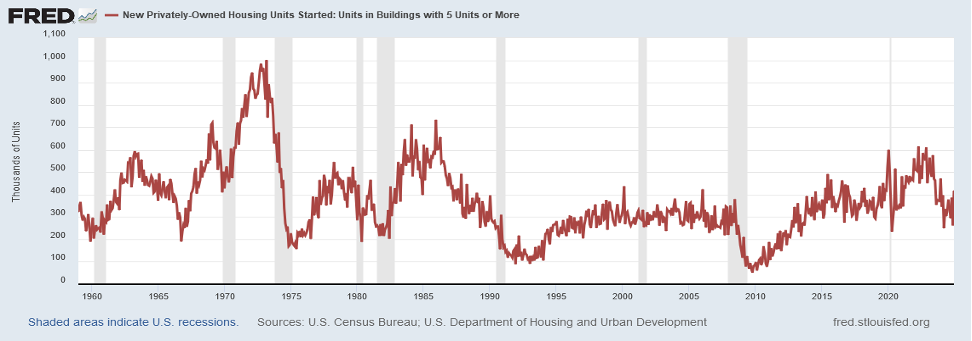
While Single Family Housing Starts continue to hang in, due to the fundamental shortage of units, Multi-Family Starts collapsed over the past two years by 50% and stand 25% below the level they averaged pre-Pandemic:
With a slowdown in Housing, other parts of the economy need to make up for this. The obvious one is Capital Expenditures. Capital Expenditures continue to move to new highs with the U.S. Government encouraging the movement of manufacturing back to the U.S.:
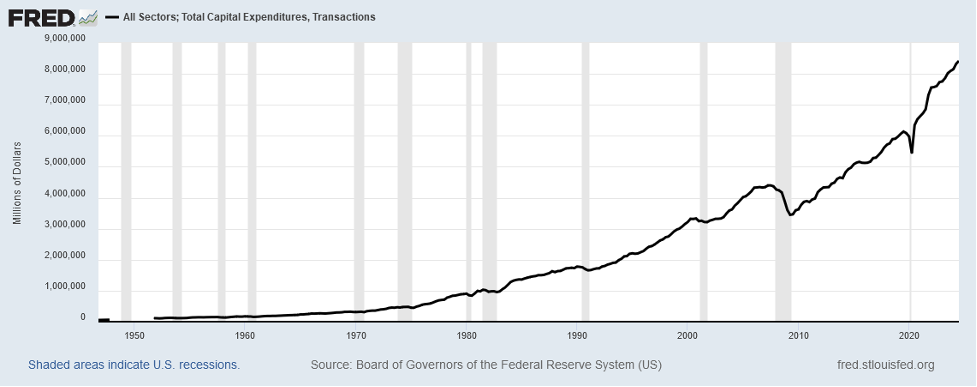
And the level of spending has begun to recover relative to the economy as well. It appears on the way to levels last seen pre-2000 when the U.S. produced a much larger share of the goods it consumed:
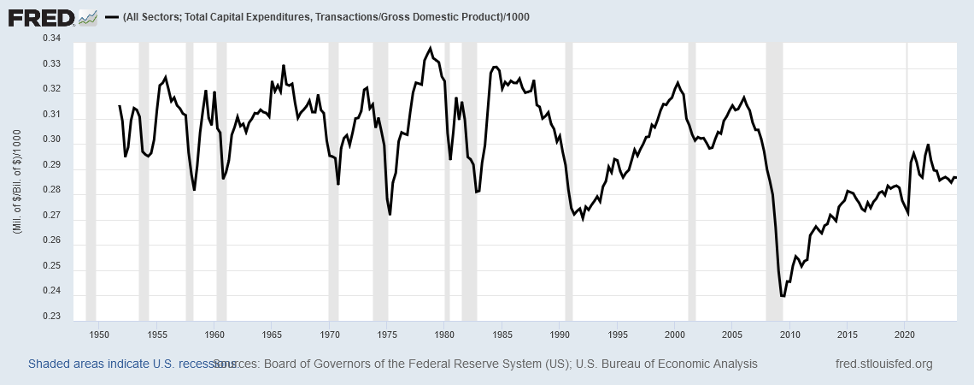
Having ranged between 28.5% and 30% the last few years despite the recent collapse in Housing Construction, this stands just below the median pre-2000 level of 30.5%. With a little more encouragement from the Government, plus a move to address the massive overvaluation of the US Dollar and the U.S. Government’s underspending on capital investment, Capital Expenditures could return to their pre-2000 range of 28% to 33% of GDP.
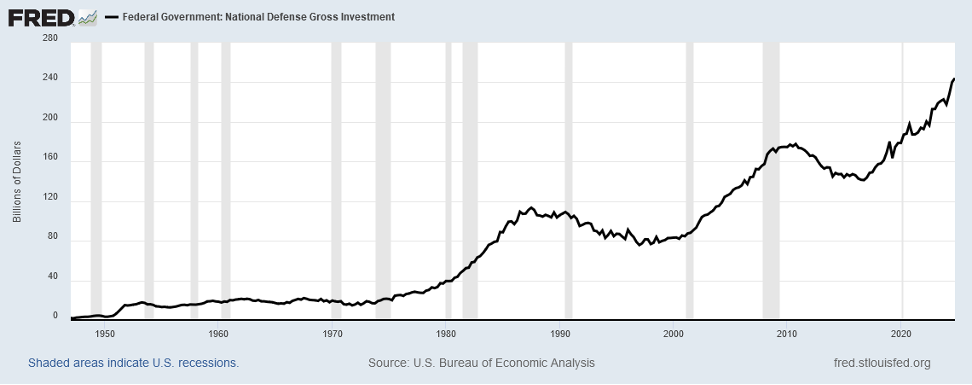
One area that could easily add 1% to the level of Capital Expenditures stands Defense. Those critical of Defense point to Nominal Spending at record levels:
But relative to GDP, National Defense Investment stands well below prior levels and those needed to sustain the U.S. Defense Posture and Industrial Base:
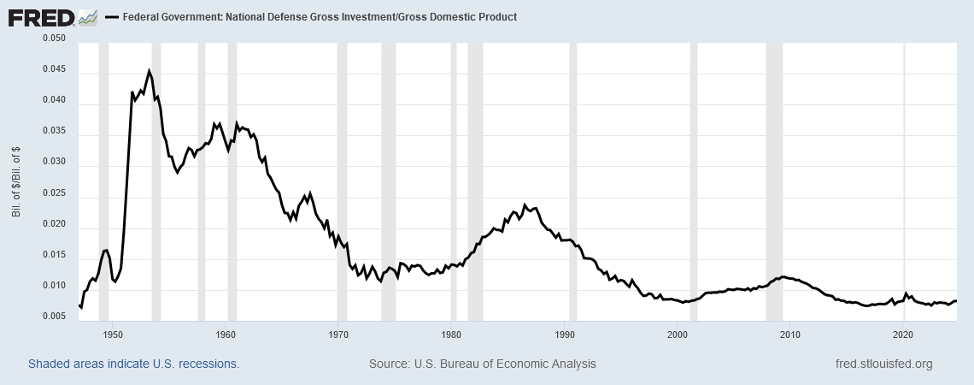
Today’s level would need to increase more than 50% in real terms to reach the levels under President Carter in the 1970s and would need to increase 150%+ to reach the median levels under President Ronald Reagan in the 1980s. While to reach the peak levels under President Reagan, Defense Gross Investment would need to more than triple. Should defense just move back to President Carter’s levels, this would add ~0.5% to the Capital Expenditures to GDP. And should they move to President Reagan’s levels, Defense Investment would add 1.5%.
Housing stands another area that could easily add to Capital Expenditures. Should Interest Rates merely move sideways along with home prices, then Affordability would recover as income rises over the next few years. This would accelerate Housing Turnover and New Home Sales. Rising Housing Turnover leads to increased renovation with a lag, adding to Capital Expenditures. And increased New Home Sales would lead to rising levels of New Home Construction. Combined, these could easily add 1%+ to Capital Expenditures. Combined Housing and Defense would then add 1.5% – 2.5%+ to Capital Expenditures bring the U.S. Total Capital Expenditures to GDP to 30.5% – 31%+. This would restore them to their 1990s levels.
Lastly, the Trump Administration plans to embark on a series of Tariffs, beginning with China, Mexico, Canada, and the EU. In addition, it plans to eliminate the De Minimis Exemption, which allows foreign companies to sidestep existing U.S. Tariffs. While the size of these tariffs will create much noise, their impact will produce mixed results. Companies and countries will focus on Transshipment, whereby they move their goods through a third party country. The solution, of course, given the massive ERP Systems that most companies employ, will stand Certificates of Origin, whereby goods will need to get Certified that they originated with components produced in countries that either do not have Tariffs or in countries whereby the manufacturers paid the Tariffs. Thus, transshipment will become difficult to implement successfully.
In addition to the above issue with Transshipment, Countries will depreciate their currencies to offset the impact of the Tariffs. This stands a time honored tradition among countries. And, in fact, led to the naming of the infamous Currency Devaluation during the 1920s and 1930s with the moniker: Beggar Thy Neighbor. In today’s case, the rest of the Global Economy devalued against the United States Dollar to maintain their Global Competitiveness against each other and the United States. Japan’s recent 30%+ devaluation just highlights this modern Beggar Thy Neighbor currency war. The following long term chart of India’s Rupee illustrates this continuing issue for the U.S.:
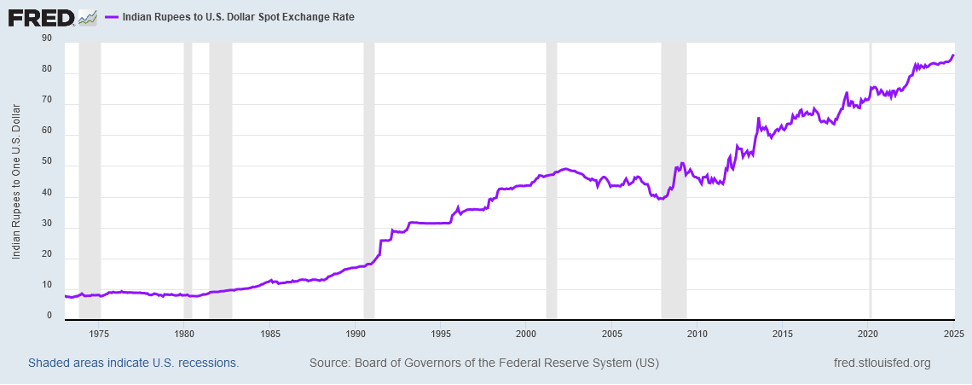
In January, 2017, the India Rupee Exchange Rate stood at 67.5 Rs per US Dollar. Today, this stands at 86.2 and headed higher. In other words, the Indian Rupee stands 21% below its level of eight years ago. All else being equal, this means Tariffs up to 20% would merely restore the economic relationship to where it stood in 2017. And, as the chart indicates, it appears that India moved recently to put in place another round of Currency Depreciation to offset any potential Tariffs that might get imposed in the near future. Thus, without addressing Currency dynamics, Tariffs may become a Paper Tiger, or what is known more colloquially as an empty threat. One can also note that the India Rupee stood at 46.5 in January 2001. Thus, since India entered the WTO, it lowered the value of the Rupee against the U.S. Dollar by more than 46%. Of course, this type of Devaluation makes complete sense given the access that the WTO granted to markets hitherto inaccessible to countries like India and the Competitive Advantage that they gained by doing so.
However, as the accompanying piece, Currency Wars, Part VII: Competition, Devaluations, and The U.S. Response, makes clear, the US. likely will begin to respond in the Currency Markets to prevent countries from manipulating this to their advantage, as they have done since the WTO came into effect in 2000. Once the U.S. moves down this path, then the shock to the Global Economy will widen massively. This will create an inability to offset Tariffs with Currency Devaluations. For countries that depended on this modus operandi to benefit and protect their manufacturing sectors, a new era will begin. The net effect of such Currency Intervention will stand large, creating some form of de facto Fixed Exchange Rate System. And, prior to enforcing such a system, the U.S. may undo the current overvaluation of its Currency much as it did in the 1930s.
With the U.S. Economy beginning to resemble that of the 1990s, the economic playbook from that era will become more the norm than the exception. In that era, Manufacturing stood a much larger portion of the economy. Should the U.S. head this way then enormous changes in resource allocation within the country will occur. This change will bring to the fore the need for more energy and electric production to support the manufacturing, more trucks and railcars to move the goods, more capital investment to support the plants, and higher investment in infrastructure to support the sector’s needs. In addition, Housing will resume its traditional role with broadened availability to a larger portion of the population. And while cyclical to Interest Rates, it will continue to roll along once wages catch up with costs. Lastly, the U.S. Government will invest more into the country for both Defense and Infrastructure. And with all this combined, Capital Expenditures to GDP will return to its traditional pre-2000 range. For the US, as it makes The New Climb, the climb will resemble an echo of the past, a form of Back to the Future, where the future of the country will resemble its past much more than the past 25 years.
Eating Out, Road Kill, and Love That Denim
Finally, we close with brief comments on Eating Out, Road Kill, and Love That Denim. First, after 20 months of declining traffic, the National Restaurant Association reported that traffic rose in November on a year over year basis. Given this, it appears the consumer is returning to Eating Out. Second, tariffs will likely raise the cost of imported cement, much of which comes from South of the border. With road budgets already under pressure from rising labor costs and previous cement price increases, we see them becoming Road Kill. And Third, the consumer can’t get enough of those skinny jeans. Levi Strauss reported that Americas organic growth exceeded 9% in Q4. It appears that consumers Love That Denim once more.
In Closing
Should you have any questions on how the above issues or the items discussed in our accompanying cover letter impact your family’s financial position or your business’s future as well as the potential actions you could take in response, please do not hesitate to contact us. We welcome the opportunity to discuss this with you.
Yours Truly,

Paul L. Sloate
Chief Executive Officer