Global Economic Quarterly: Every Country for Itself

Views From the Stream
The Monthly Letter covers two topics this month. First, we provide our Global Economic Quarterly. Rising Geopolitical strife continues to accelerate the decoupling of the Global Economy. With the U.S. and China moving to disentangle their economic relationship, countries around the world continue to face issues in serving two masters. And with National Security coming to dominate both countries view of the world, the Global Economy should continue to initially split along a China vs. U.S. axis and then splinter further, as the U.S. moves to re-domesticate supply chains it allowed to move abroad. Second, as always, we close with brief comments of interest to our readers on a variety of current topics relevant to the economy and the markets.
Global Economic Quarterly: Every Country for Itself
The fracturing of the Global Economy continues to accelerate. Initially splitting along US – China lines, but inevitably headed to a much more fractured universe of economic trading blocs. A simple example will illustrate where things sit currently. Astra Zeneca, the global UK pharmaceutical firm and one of the largest in the world, announced that it would create a completely separate supply chain to deliver pharmaceuticals to the Chinese market that did not touch anything related to the United States. As this example illustrates, Astra Zeneca fears U.S. or Western sanctions that would prevent it from accessing the Chinese marketplace. While global companies continue to believe they can serve two masters, it stands unclear whether governments will allow this type of economic cooperation with a global geopolitical rival to last. One need only look at the U.S. Government’s investigation of Applied Materials, one of the top global manufacturers of leading edge semiconductor equipment and its sales to China.
In addition to global companies moving to create separate supply chains, China continues to move down the path to create domestic companies to displace foreign corporations supplying its market. China’s massive investment into technology to make itself independent of the rest of the world continues to accelerate as China stands up company after company to produce everything from electronic chemicals to autos to batteries to healthcare technology to semiconductor equipment. And with all this capacity coming online, China ordered its industrial companies to absorb this capacity by shifting purchases to domestic Chinese companies instead of importing foreign product. As an example, China ordered its auto industry in early May 2024 to purchase at least 25% of their computer chips from Chinese manufacturers by 2025, up from less than 10% today. In addition, the Ministry of Industry and Information Technology plans to replace foreign suppliers of electronic control units, displays, thermal and charging supply systems, and other electronic components in the auto industry with parts sourced from domestic manufacturers. As China moves to accelerate this National Policy, the willingness of foreign countries to accept such a state of affairs, whereby China shuts out their products but expects them to accept its surplus manufactured goods, appears limited. In effect, China continues to recreate the conditions that led to the Opium Wars. At a minimum, this will lead to rising global economic strife as Developed Countries shut out more and more Chinese goods.
However, China stands not the only country that wants to become independent of outside imports for major portions of its economy. India continues down this path with massive incentives to locate technology production in the country of up to 70% of the investment. And the country continues to invest in infrastructure to enable it to massively increase its industrial output. Malaysia possesses its 2024 Industrial Master Plan to create domestic semiconductor production, create 3,000 factories of the future, and drive high value manufacturing exports by 2030. In January 2024, Brazil adopted its New Industry Brazil policy (Nova Industria Brasil) that provides R300 billion (US $58 billion) in subsidies for industrial development for 2024 – 2026. Kenya provides significant incentives for foreign investment, including a 10 year income tax exemption followed by a 10 year tax subsidy. For the Global Economy, an investment scramble stands underway where countries around the world attempt to incent the location of production in their countries, regardless of whether they can absorb the output.
However, with countries and regions like the U.S. and Europe becoming less welcoming for these goods, as they need to meet their own economic growth and national security goals, which requires creating domestic production capacity and protecting existing manufacturing capacity from this onslaught of Investment, the probability that this massive Investment into production will lead to significant surplus capacity globally continues to grow. And with the natural 10 Year Economic Cycle coinciding with all this capacity arriving later this decade, there exists the potential for a deep global downturn as the world approaches 2030. However, prior to the end of the decade, an Investment boom should rule. In many ways, this setup looks similar to that of the 1920s, which ended poorly. However, unlike the 1930s, this downturn will impact the export oriented economies of Asia much more. For a country like the United States that imports many goods and produces less than 50% of the goods it currently consumes, the downturn should stay manageable as it can continue to invest to produce more of the goods it consumes while internal production and consumption can balance themselves. However, for a country like China, the outcome could prove difficult to disastrous as the surplus capacity in its economy would not find markets to serve. As the decade progresses, Every Country For Itself will come to dominate as countries seek larger pieces of the Global Economic Pie at the expense of other countries. And, with each country putting its interests first, the likely outcome stands rising levels of economic strife, even before a major global economic downturn. And, unfortunately, history demonstrates that major economic downturns often lead to wars as countries move to put the population to work by creating a wartime economy.
Dragon Bounce
China continues to move to address its Housing crisis. To understand the extent of this crisis, China’s Real Estate Investment accounted for 14.0% of GDP in 2021. In Q1 2024, it only contributed 8.4% of GDP. New Home Sales are down 46% in value and 48% in square footage over this time frame. New Home Starts, measured in square footage, stand 60% below their 2021 peak. And prices stand down ~10%, modest fall by Housing bust standards. But even down to just 8.4% of China’s GDP, this number stands massive given the shrinking Chinese population. To put this into perspective, at the height of the U.S. Housing Bubble, U.S. Gross Fixed Investment for Residential Housing only reached 6.7% of GDP. To combat its massive oversupply of space as well as the thousands of uncompleted projects, the Chinese Government focused on several major policies over the past year. First, it continued to support State Owned Enterprises (SOEs) in the Housing industry. For private sector competitors, it allowed for defaults and foreign investors and lenders to take the pain. Second, it moved to create a “White List” of private sector projects. For these projects, the government provided financing to complete them in order for buyers to feel comfortable purchasing these units. To date, builders received between $85 – $90 billion in financing. Third, China announced a “Cash for Clunkers” program for Housing for owners of existing Housing units to swap them for new ones. In this case the government will provide free options on new units or the government will buy the old unit from the homeowner.
However, these policies will not solve the fundamental issues of over-Supply for the sector. Current new homes under construction stand above 5 billion square meters (bsm) of space. This stand equivalent to 3 – 5 Years of normal demand. (Normal Housing Demand appears 1.0 – 1.5 bsm per annum.) In addition, Vacancy Rates stand above 20% according to private estimates. This represents another 2+ Years of Supply. As such, the government plans to purchase a significant number of units to turn them into Public Housing and effectively remove them from Supply. Even with all these actions by the government, Housing likely will continue to shrink relative to the economy for several more years before finding some form of bottom in the late 2020s, acting as a long term, economic drag.
Despite this clear drag from Housing, which created an ~1.5%+ per annum drag on GDP, China’s GDP grew 5.2% in 2023 and 3.0% in 2022. In addition, China’s GDP grew 5.3% in Q1 2024 according to official government statistics. This brings up the question of China’s economic statistics once more. In order to reach these lofty growth goals, which seem to defy the economic gravity of a major downturn in Housing, China reported Real GDP above its Nominal GDP. That stands a highly unusual outcome for a country. If one were to apply some nominal level of Inflation, say 2% to this Nominal GDP, then Real GDP would stand at less than half the reported rate:
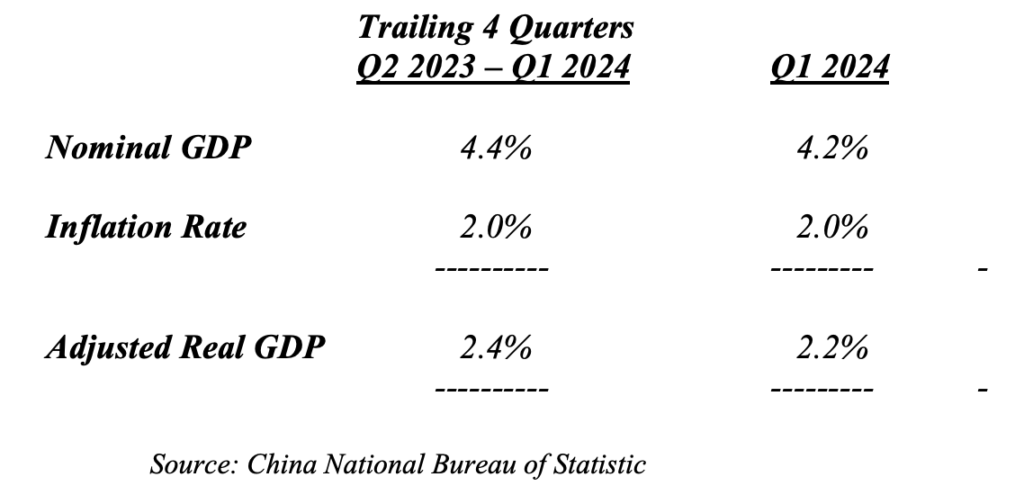
Given the downturn in Housing, such a statistic makes much more sense. And given such statistics as Youth Unemployment running over 21% in 2023, this seems to reflect the underlying reality. (Note: China withdrew this statistic after the June 2023 report of 21.3% and just started to republish it in February 2024. The statistic read 15.3% this year after a “data revamp”.) Retail Sales also exhibited a major slowdown in 2024, slowing to just 3.1% Year Over Year (YOY). This would stand consistent with slower economic growth.
In order to offset the clear disaster in Housing and slowing Consumer spending, instead of stimulating demand to absorb the surplus goods in its economy, China stepped on the Investment and Export accelerator. Fixed Asset Investment (FAI) growth, which slowed in 2023, reaccelerated this year. And, in particular, it reaccelerated in Manufacturing and the Transport Infrastructure necessary to move the larger volume of goods. Manufacturing FAI, which grew at ~6.3% in 2023, accelerated to over 9% in Q1 2024, reaching 9.9% YOY in March. For a country with significant surplus manufacturing capacity and insufficient domestic demand, this economic policy contradicts what the circumstances normally would dictate. However, this policy stands consistent with China’s Made in China 2025 Policy. With the amount of goods produced by its economy growing well in excess of the ability to absorb them, Export Volumes grew 14% Year-Over-Year (YOY) in Q1 2024.
This growth in production occurred despite China wages standing well above those of Mexico and many other countries. This stands another long term challenge to Chinese economic policy and its long term sustainability. The following chart illustrates China’s dilemma and why it continues to move up the manufacturing spectrum to higher value goods similar to the goods produced in the European Union, Japan, or the United States:
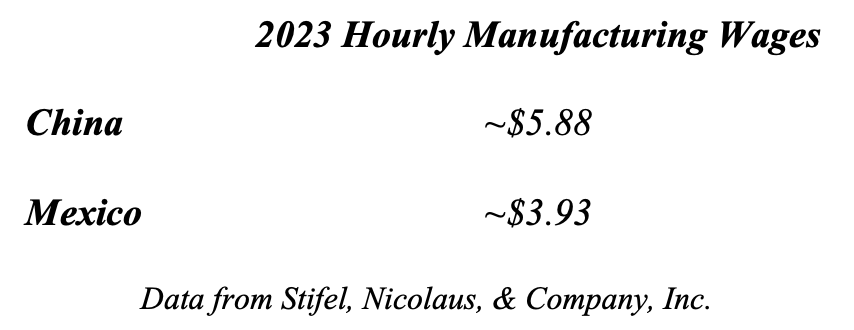
When adding in transportation costs from China, this makes Chinese goods even less competitive and leaves its economy vulnerable as other Developing Economies industrialize. While China can follow an Industrial Investment and Export led policy in the short term to fill the hole in its economic growth, it stands unsustainable in the intermediate term as countries move to cut off its Exports. It merely delays the Day of Reckoning while creating a larger economic problem in the future. With a Dragon Bounce under way, the question remains how long it can stay in the air before the reality of its Housing sector and the rising Trade tensions drag it back to the ground.
A Rising Sun
For Japan, the massive devaluation of the Yen stands front and center. With an almost 35% devaluation against the US Dollar since 2021, this makes Japanese goods competitive with the numerous Emerging Market economies that have steadily devalued over the past decade. For example, India’s Rupee feel from 45 per US Dollar in 2015 to 83 today. This 45% devaluation now stands mostly offset by Japan. In addition, with Japanese average monthly cash earnings down to US $2,200 from US $3,800 in 2012, this makes Japanese workers hypercompetitive with those in the U.S. and Europe. As a result, Japan’s Corporate Profits to Sales Ratio surged over the past few years from 4.7% in Q4 2020 to 7.0% in Q4 2023. Of course, with a lag, capital spending continues to surge as corporate profits exploded upward. When this is coupled with the Bank of Japan effectively monetizing Japan’s National Debt, accelerating Nominal GDP Growth stand the obvious results, further boosting corporate results. The only question for Japan consists of the rate normalization path. With Inflation beginning to become somewhat of a political issue, the government began to put pressure on the Bank of Japan to address rates. Regardless of the path, A Rising Sun seems in place for now.
Tiger Tales
For the countries of Asia, outside of China, the trade tensions between China and the U.S. stand a boon. As companies move to relocate supply chains from China, countries such as Malaysia and Vietnam stand large beneficiaries. Indonesia, Malaysia, Vietnam, and The Philippines all reported growth in excess of 5% YOY for Q1 2024. While each country continues to choose a slightly different path, all rely on the upgrading of their manufacturing capacity to drive exports. Indonesia continues to leverage its nickel reserves to gain share in electric vehicle battery production. Japanese companies recently announced a number of investments into this area. Malaysia’s focus on manufacturing and electronics seeks to position the country to become the location of choice for supply chains moving out of China. It continues to see large amounts of FDI (foreign direct investment) into its manufacturing sector. Vietnam now stands a major factor in mobile phone production. Investment continues strong as the country seeks to add other manufacturing verticles to its capabilities. The Philippines focus on BPO (business process outsourcing) continues to benefit from its well-educated populace. In addition, the country’s capital investment accelerated over the past year. And the country should benefit from the U.S.’s increased presence and spending on defense. For the nations of Southeast Asia, Tiger Tales once more dominate the narrative.
A Productive Elephant
India continues its rampant growth, going through the modernization that China experienced during the 1990s and first decade of the 2000s. Basic infrastructure and services to its huge population stand the drivers coupled with industrialization and a cyclical turn upward in housing. Private Sector Capital Expenditures rose from 26.5% of GDP in calendar Q4 2020 to 30.9% in calendar Q4 2023. This stands the highest level since 2014. In addition, Government Capital Expenditure exploded upward over the past year, rising 28% for the Fiscal Year ended in March 2024. With an election in the country during calendar Q2 2024, the government projects an additional rise of 17%+ over the next Fiscal Year, bringing its overall capital expenditure growth to almost 50% over these two years. As a result, the country’s Gross Fixed Capital Expenditures to GDP, which stood in the 35% – 36% range from 2012 – 2017, exploded upward, recently exceeding 50%:
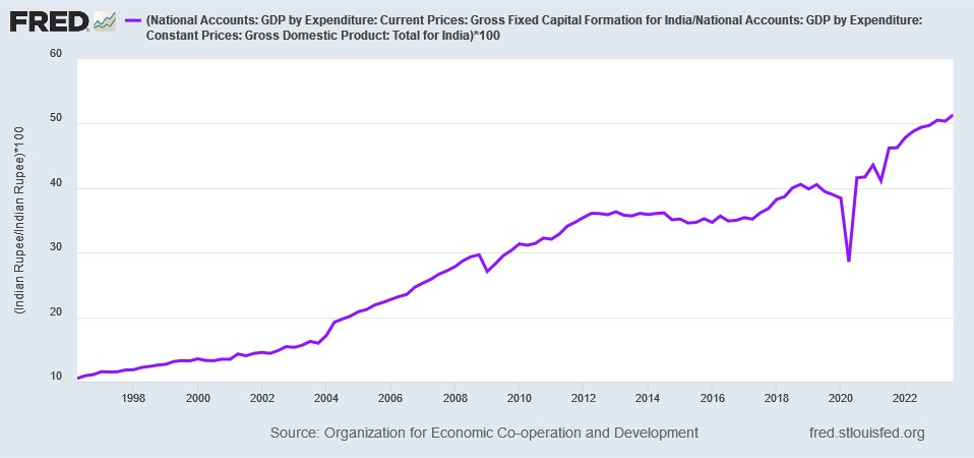
With strong fundamental growth drivers in place, India’s economic growth exceeded 7% for the year ended March 2024 and the Royal Bank of India projects another year of 7%+ growth ahead. With India’s Investment transforming its economy, the Productive Elephant should have numerous strong years ahead.
The African Beat
Sub-Sahara Africa comprises 50 countries with a population of over 1.2 billion people, with a birth rate that produces 2.5% population growth per year. It possesses a land mass the size of North America with a GDP per capita of almost $1,700. GDP will exceed $2 trillion in 2024 and is growing at almost 4% per year. Household income remains low at just $762 per year. However, these statistics stand well above a country like India, where the household median income is below $300 per year and GDP per capita is ~$1,200. While the continent, as a whole, represents a diverse group of 50 countries almost all continue to grow consistently, given the stage of development. Not surprisingly, Eastern Africa, with its proximity to Asia, continues to grow at a much more rapid rate than West Africa, which is more commodity dependent, as the following table demonstrates:
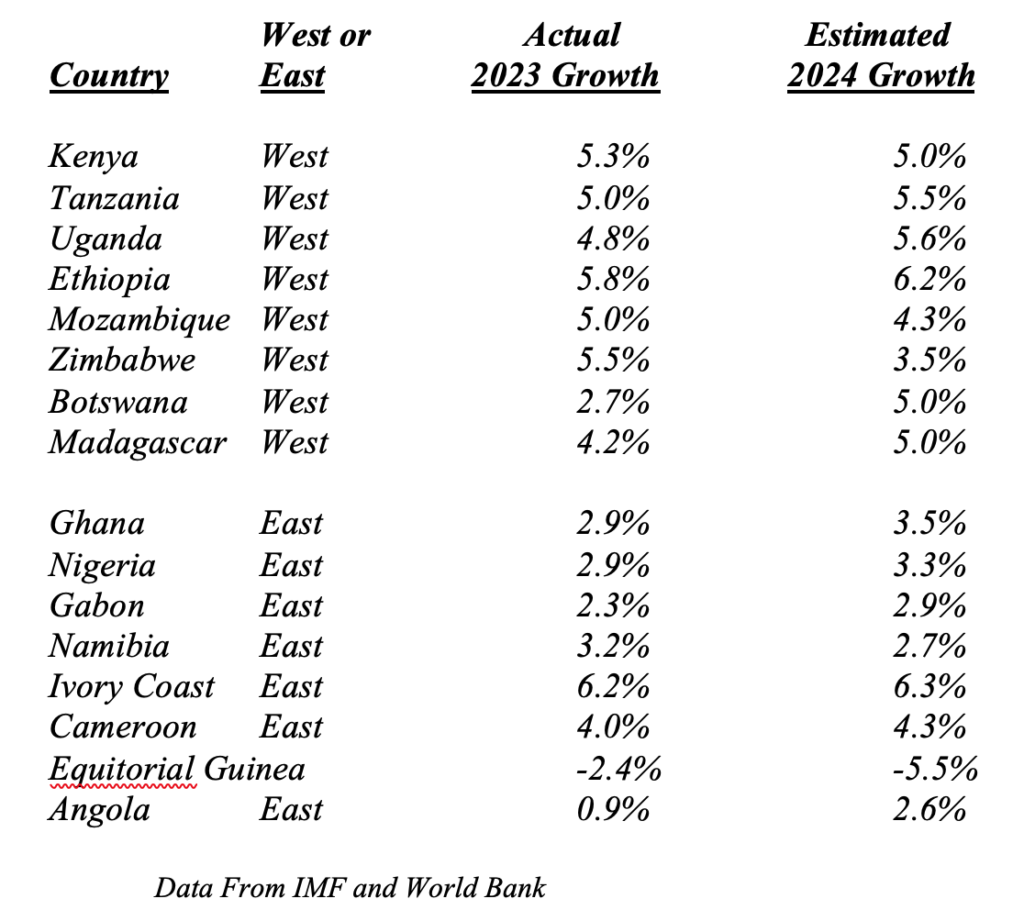
With huge opportunity, Sub-Saharan Africa continues to attract significant foreign direct investment (FDI) due to its low wage labor force, natural resources, and stage of development. In 2023, this area attracted almost 2.4% of its GDP in FDI. For example, the Gulf Cooperation Council announced investments in excess of $53 billion over several years. into this region. This equates to 2.5% of Sub-Saharan GDP in 2023. With investments from numerous other countries on the rise as well, coupled with its strong fundamental economic growth, the sounds of The African Beat will continue to sound loudly throughout the globe.
A Samba Party and No Tango
For South America, economic fortunes continue to diverge between the two largest economies, Brazil and Argentina. For Brazil, growth continues to chug along with the economy growing 2% – 3% on average. Of course, Brazil, like many other Emerging Market countries, depreciated its currency massively over the past few years, utilizing the Pandemic as an excuse to gain global competitive position:
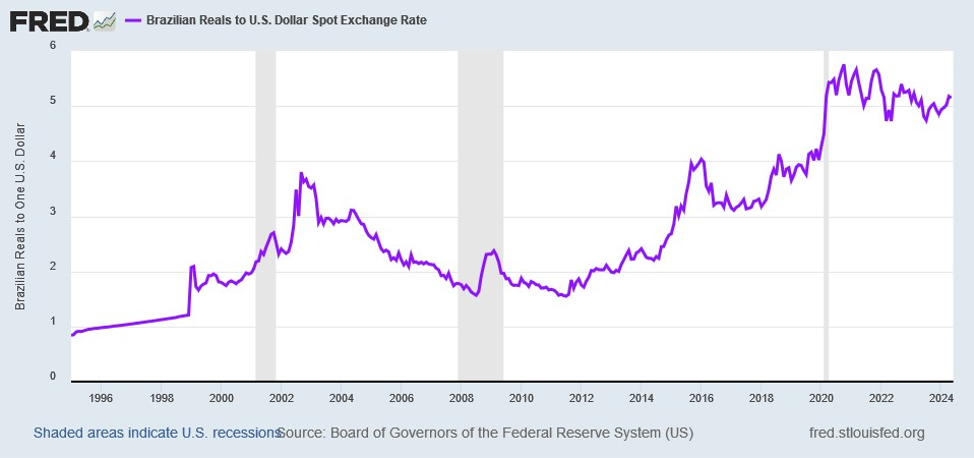
From just the Pre-Pandemic period to today, the Brazilian Reals went from ~$0.32 in value to $0.20 in value, which equates to a 37.5% depreciation. And even when viewed in the context of the global competitive devaluations, Brazil’s Real Effective Exchange Rate matches the lows from the late 1990s/ early 2000s period:
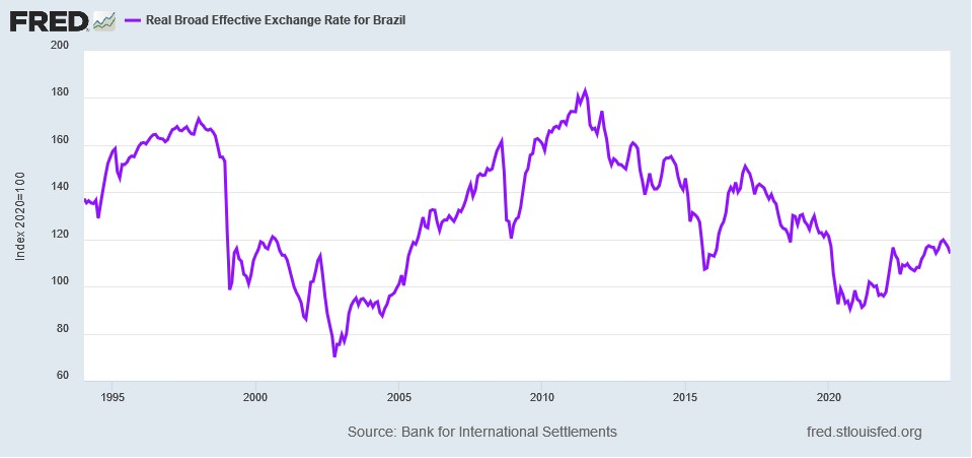
One might say that Brazil continues to build its economy utilizing the model of many EM countries, an undervalued currency coupled with a push into industrialization to continue to build its economic foundation. With inflation relatively under control, the beat of The Samba Party can clearly be heard in the streets.
For Argentina, a country with so much promise in the 1930s, a century of mismanagement continues to plague its economy. With the former regime creating massive Inflation, the country needed shock therapy to end the chaos. As a result, Argentina’s economy will shrink 3.5% – 4.0% this year, after shrinking 1.6% last year. For the country, this will just extend the period of economic stagnation, which began in 2011, a bit longer:
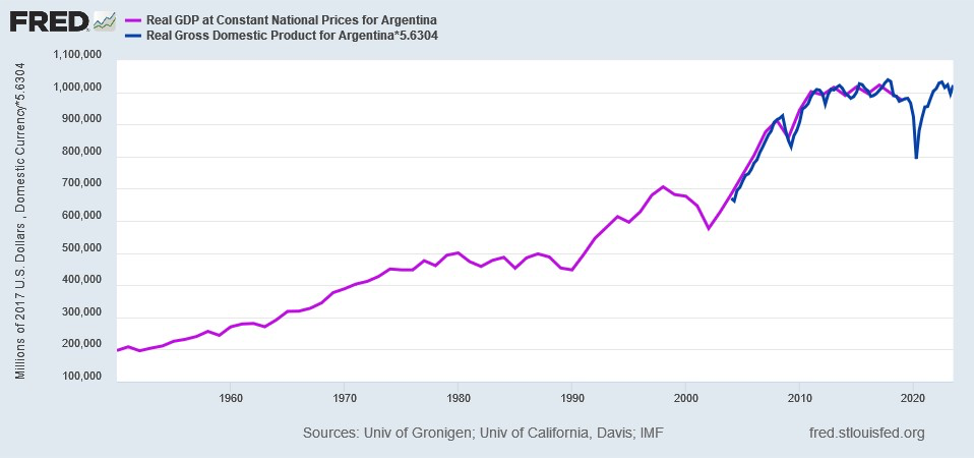
But, with the effective dollarization of the economy, it should set the stage for sustainable growth after the period of pain. As with Greece and Iceland, after major economic pain, a sustainable economy with real economic growth should emerge. For Buenos Aeres, there appears No Tango for at least another year.
The Old Man “Recovers”
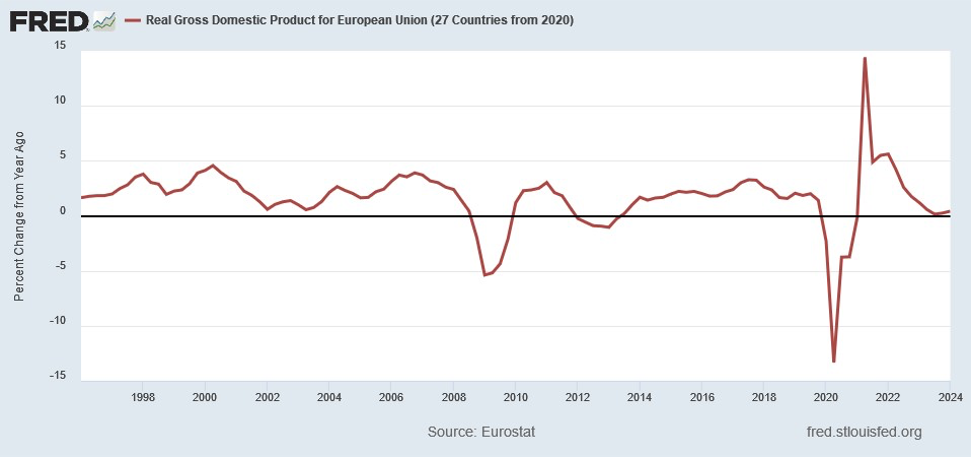
Europe stands caught between its economic interests and its geopolitical interests. From 2000 – 2020, Europe ignored global geopolitics, tying its economy to Russia and China. While this boosted the Continent’s growth, by leveraging cheap Russian natural gas to drive its industry and exporting copious amounts of capital goods to China, it created strategic vulnerabilities which came home to roost over the past few years. Russian gas imports ended abruptly and China set its sights on the core European capital goods and high value consumer goods exports, with a plan to displace them both globally and within the EU. Both these events significantly impacted the EU’s overall growth:
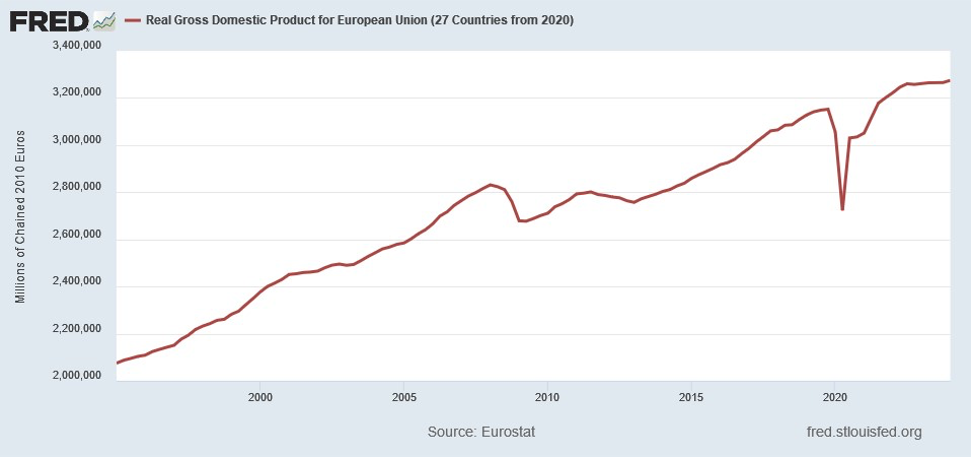
The result, GDP for the 27 countries in the EU compounded at a 0.92% rate from Q1 2019 to Q1 2024, growing just 5.7% over six years. To put this into perspective, US GDP compounded at 2.2%+ over the same time frame despite the rise in the US Dollar. And since the Pandemic boost, EU growth collapsed:
In addition to the above external challenges, the EU faces internal divisions between both the North and the South as well as the West and the East. In order to keep Southern Europe as part of the EU, Germany continues to feed resources to Italy and Spain to boost their economies, as Germany siphoned off economic growth from the South over the decade of the 2010s and must allow these economies to catch up. The following chart demonstrates the economic performance of Germany compared to Spain and the outperformance that Germany gained from 2008 to today:
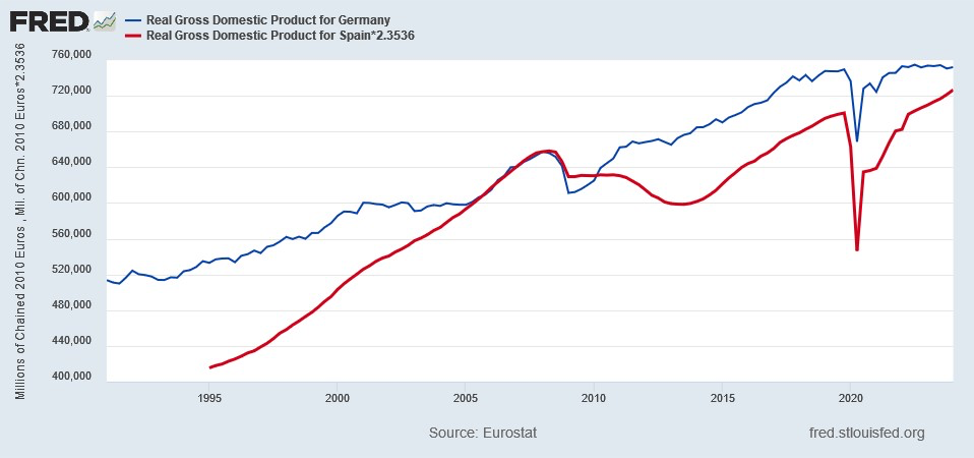
To keep countries, such as Spain, in the EU requires continuing boosts to their growth. Italy already positioned itself to leave unless the benefits exceeded the costs of membership, thus becoming the recipient of the largest share of the European investment funds. In addition to the above challenges, there exist political divisions as well. Hungary seeks to play the EU against China, accepting investment from whomever will come. And this does not play well in Brussels. Much of Eastern Europe did not adopt the Euro, enabling it to manage its currencies and maintain a somewhat independent economic policy while benefiting from Western European investment and access to those markets. Given these divisions, as the Old Man Recovers, it will struggle to hold it all together.
A New Climb
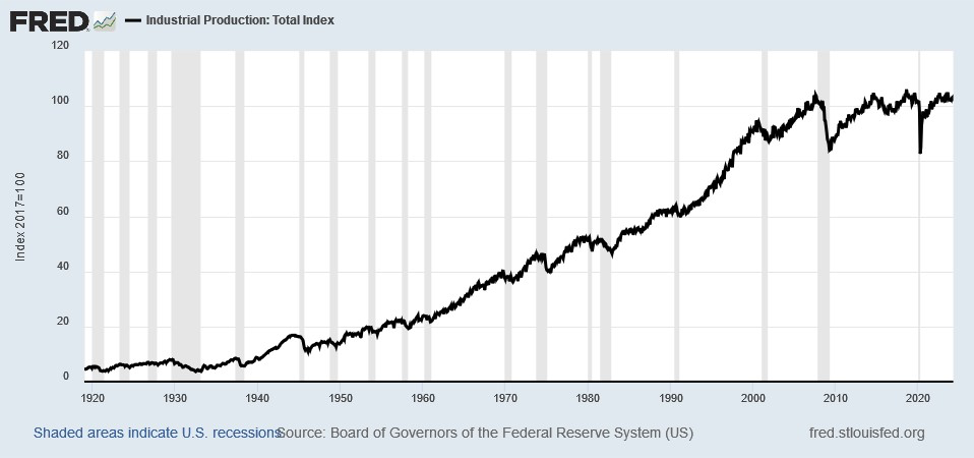
For the United States, the exigencies of Geopolitics will dominate the economic landscape for the coming decades. This will mean undoing many of the economic decisions made from 1995 to 2015 as well as reversing the long term decline in military spending relative to the economy. This will represent a sea change in how the economy grows, where investment will flow, how the government allocates resources, and how the US economy will interact with the globe. It will mean, in many ways, a restoration of what existed during the 1980s and in leveraging the ability of the large domestic Consumer markets to sustain a much larger industrial infrastructure. This will require growing Industrial Production, which today stands below its August 2007 peak:
Through 2000, after the recovery from the 1930s Great Depression, Industrial Production remained relatively constant compared to the economy. While seeing a lift from the massive resources applied to the Vietnam War and the Space Race during the 1960s and 1970s, the pullback in the 1980s ultimately left 1990s Industrial Production relative to GDP similar to the 1950s level:
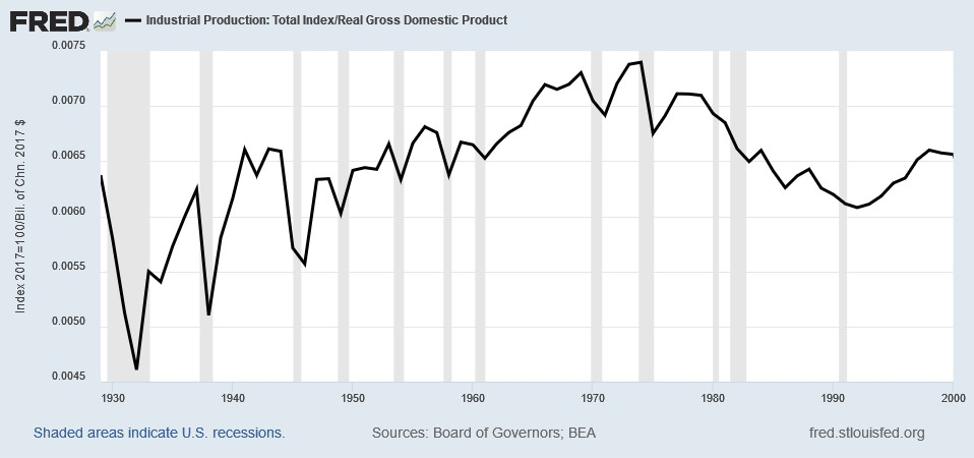
However, after joining the WTO, Industrial Production stopped growing as foreign economies siphoned off US manufacturing and exported the products to the large US market which now stood open:
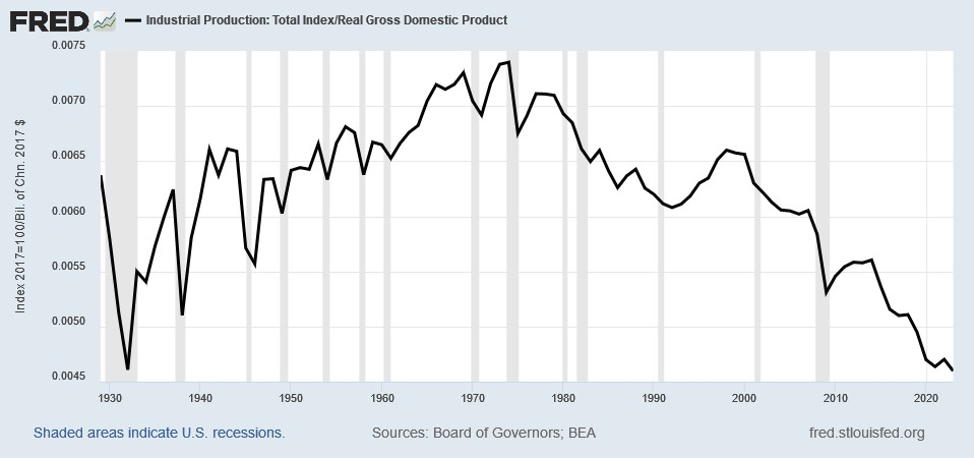
In fact, Industrial Production relative to US GDP stands at a level last seen during the depths of the Great Depression in the early 1930s.
Prior to the implementation of the WTO (World Trade Organization) in 2000, the US could address individual countries Currency Devaluations or Trade Practices through direct action under the GATT (General Agreement on Tariffs & Trade). In addition, the Emerging Markets did not have access to the US domestic markets due to their known predilection to subsidize their industry and protect their markets. However, when it entered into the WTO, the US agreed to provide access to its markets and to allow a body outside the US to determine whether it could retaliate or not for other countries’ actions. In effect, it gave up its sovereignty to a body that did not have US National Interests as a prime mover. In fact, this body proved to have the Emerging Markets’ interests at heart. In addition, the US could not retaliate against Currency Devaluations, which became a fundamental problem. The Emerging Economies, in order to make their economies super competitive once the US and European markets opened up, massively devalued their currencies during the 1990s by over 65% prior to the WTO start:
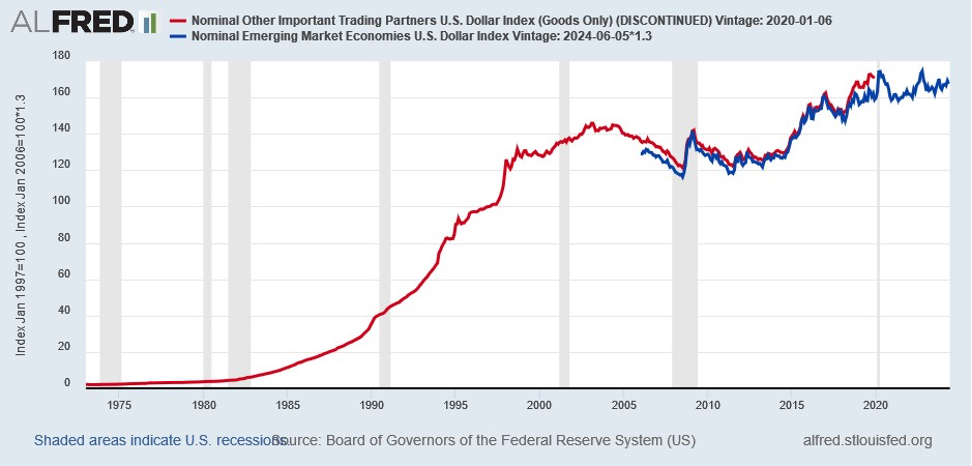
When the effectiveness of this devaluation wore off, beginning in 2015, the EM devalued its currencies, collectively, by another 20%. If one wants to wonder why U.S. Industrial production continues to struggle, this explains in simple terms how the global environment undermines U.S. manufacturing.
A simple example will illustrate this. China cut its currency in half from 1990-1995, including a massive devaluation in 1994:
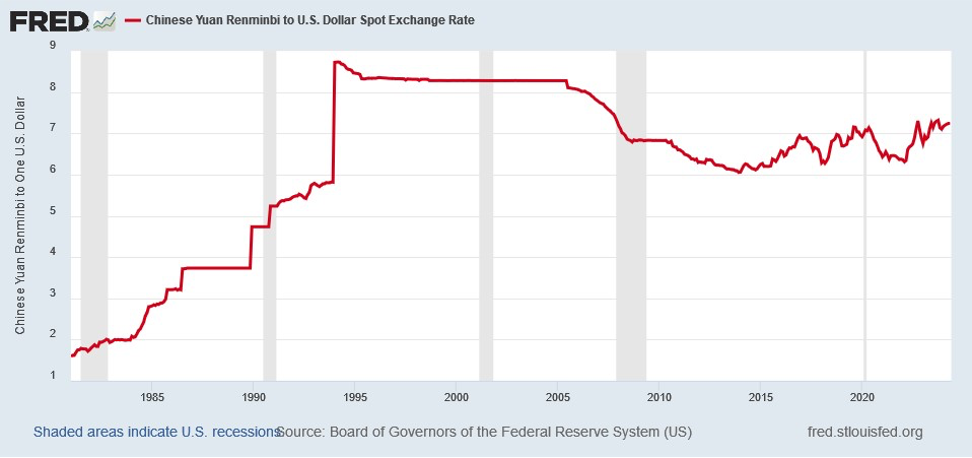
This made China hypercompetitive for goods exports in the global markets. The following table lays out how undervalued the currency stood when China joined the WTO and how that valuation changed over time:
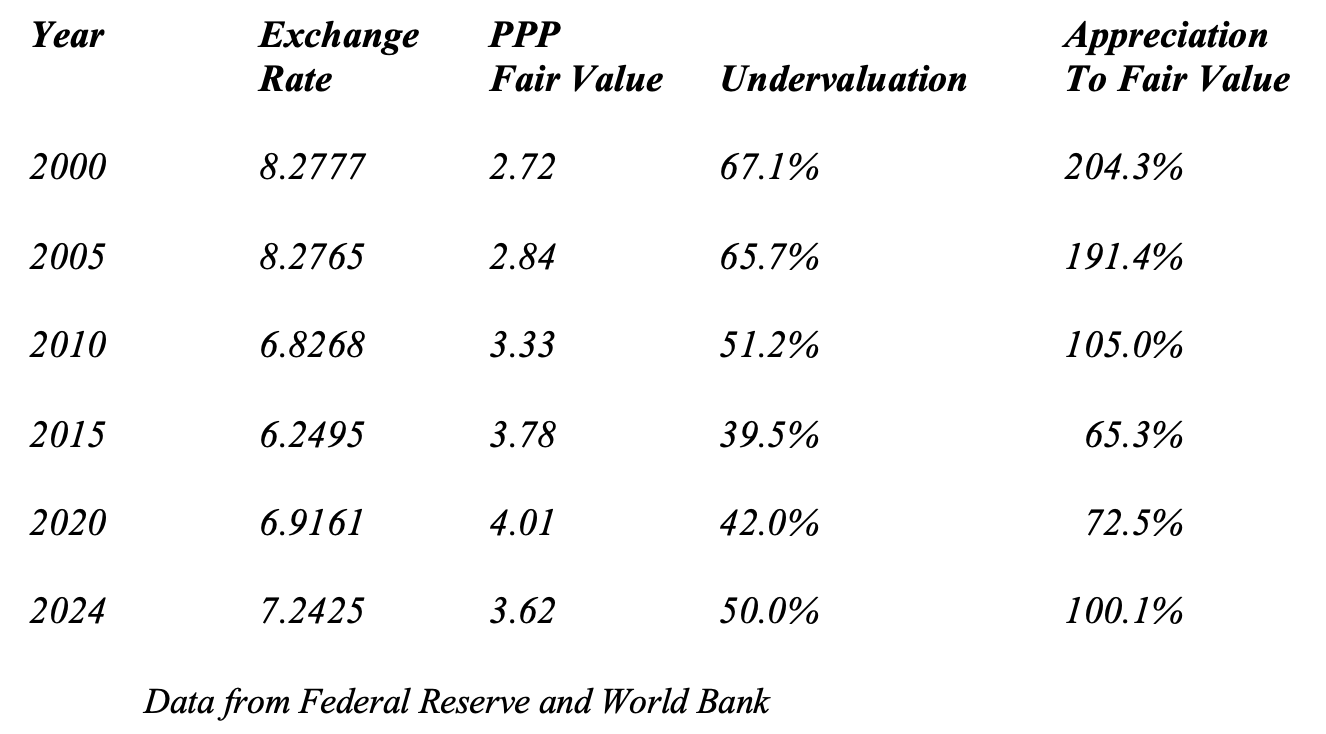
As this table demonstrates, China’s currency remains massively undervalued relative to the US Dollar. And despite this, in order to maintain its Global Competitive Position, China recently began to depreciate its currency again, despite its significant undervaluation against the US Dollar in order to preempt any tariffs that might come from the U.S. Government.
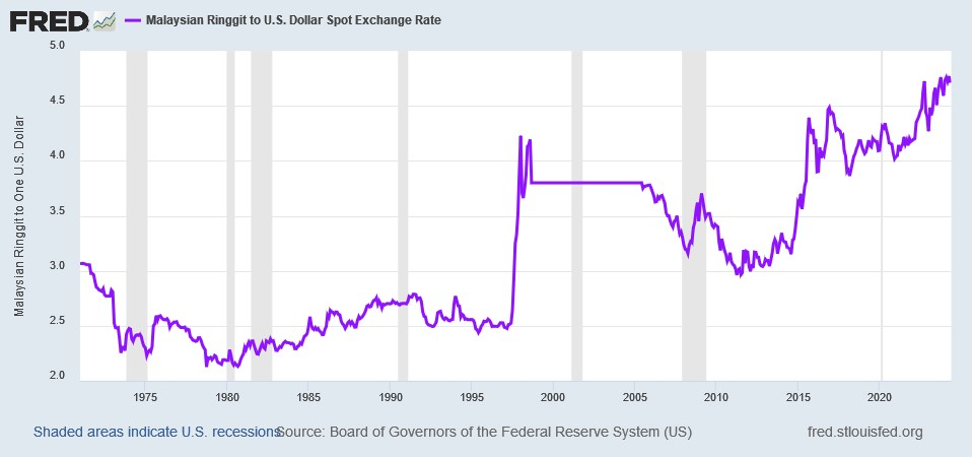
Other EM countries continue to devalue their currencies against the US Dollar as well. The following chart of the Malaysian Ringgit stands but one example of the actions of EM countries:
For the U.S., actions taken by countries around the globe, both DM and EM, represent a fundamental challenge to how the country manages economic policy. As occurred in the 1930s, where the U.S. stood last man standing as countries around the globe devalued to gain competitive position, the U.S. will need to adjust the value of its currency in order to restore its Global Competitive Position. Recent data indicate that the U.S. Dollar stands the most overvalued currency in the world, with its Real Effective Exchange Rate almost 20% overvalued. If the U.S. were to correct this overvaluation against both Developed Economies and the Emerging Markets, it would underpin the country’s ability to grow Industrial Production; it would make its goods competitive in the Global Markets; and it would boost the rate of U.S. GDP Growth. For the U.S., as the National Interest continues to rise as the determinant of policy, it merely stands a matter of time until the United States corrects this imbalance with Europe, Japan, China, India, Brazil, and the remainder of the Globe.
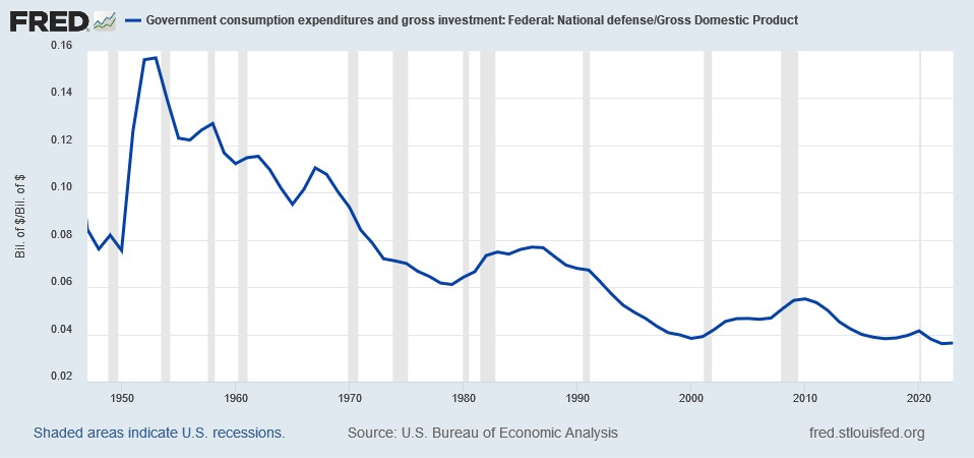
The other major issue, that the United States faces, surrounds Defense. Defense Spending relative to GDP collapsed over the past 30 years:
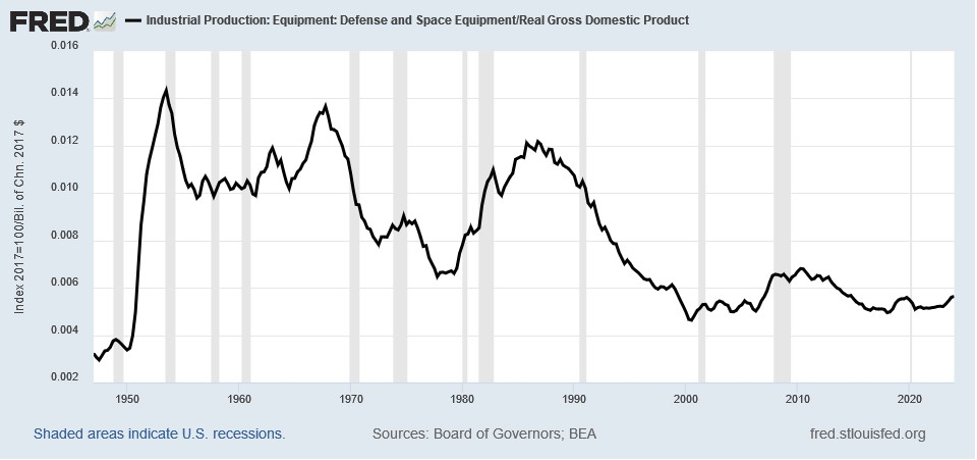
Reflecting this reallocation of resources away from Defense, Industrial Production associated with Defense collapsed as well:
In a more dangerous world, such spending levels stand inconsistent with the rising risks around the Globe. Already, a war in Europe and a war in the Middle East provide clear examples of this. And with its enemies and geopolitical rivals massively increasing military spending, the U.S. will need to return to earlier levels of Defense spending relative to GDP in order to meet the rising threats and the growing challenges to its National Security.
Occupying the opposite corner stand the various social programs enacted over the past 60 years. For the U.S., these programs represent the proverbial elephant in the room that stands forbidden from the political discourse. While the press discusses the pending bankruptcy of Social Security, known as Retirement Spending for the Federal Government, this spending stands relative constant as a percent of GDP since the early 1980s:
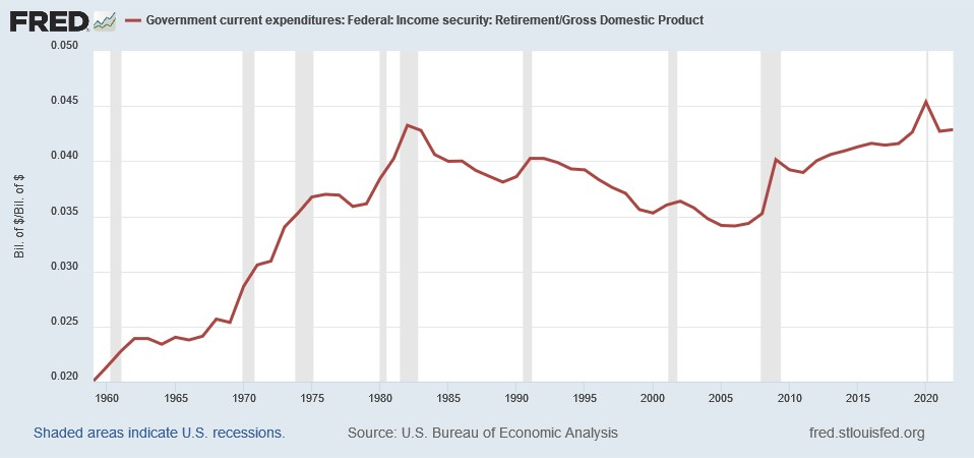
And should the economy grow as it did prior to the 2008 – 2009 Recession, this metric should fall back towards its 1990s levels. The real issue stands healthcare spending. The following chart of U.S. Government Health Spending relative to GDP through 2021 illustrates this challenge:
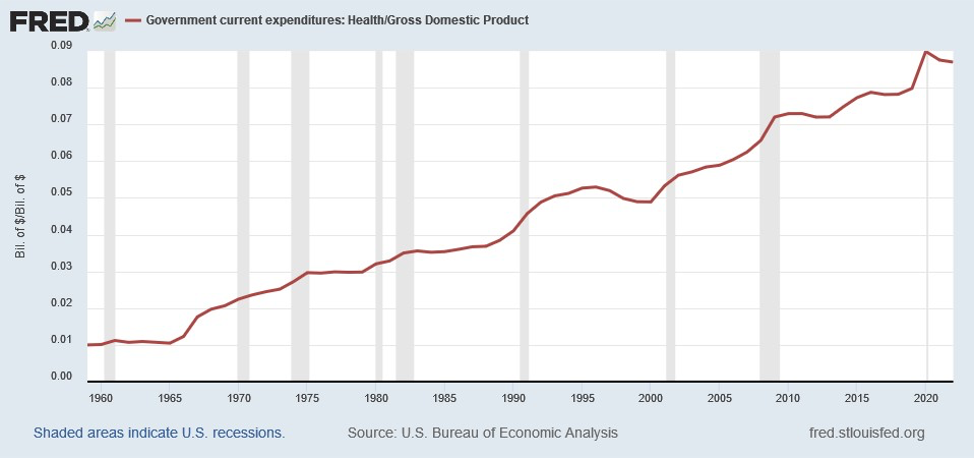
According to the Congressional Budget Office, the U.S. Government’s Non-Interest Spending to GDP should equal ~20.1% in 2024. This means Healthcare Spending will comprise almost 45% of total Non-Debt Government Expenditures. With Geopolitics and National Security once more dominating U.S. international relations, the need to increase Defense Spending in real terms, back to levels last seen in the 1980s, will come to the fore. When coupled with the need to insure domestic Industrial Capacity in critical manufacturing sectors, such as Technology, this level of Healthcare Spending, let alone the projected increases, will stand in direct conflict with the needs of National Security and domestic Industrial Capacity. As a result, Healthcare likely will face significant pressures over the next decade as the government rebalances spending.
For the U.S., the path ahead looks treacherous and difficult. The country will need to reconfigure its economy to meet the challenges it faces abroad. And it will need to ask its populace to make sacrifices to marshal the resources necessary. This will mean a massive change in how the economy functions and who will enjoy the fruits of economic growth. It appears that the first shall be last and the last shall be first relative to the past 30 years. For numerous sectors that feasted on 30 years of abundance, it appears that 30 years of famine may lie ahead. Despite this, the U.S. stands a country that embraces change and that allows creative destruction to rule. With this in the forefront, as the country embarks on A New Climb, the heights ahead will come into focus and appear achievable as they have before, despite the challenges ahead.
In Hot Water, Government Can You Spare A Billion?, and The Skinny Consumer
Finally, we close with brief comments on In Hot Water, Government Can You Spare A Billion, and The Skinny Consumer. Despite a slowdown in residential and multi-family construction, shipments of Hot Water Heaters remain strong. Both residential and commercial shipments were up strongly through April. And it appears that both will be up in the second half even with sub-normal seasonality. As a result, we see the industry In Hot Water. Second, Governments around the world continue to dangle huge incentives to semiconductor companies to locate plants in their country. India agreed to pay $7 billion of the $10 billion cost for Tower Semiconductors newest fab. Germany pledged $22 billion to TSMC and Wolfspeed to build new semiconductor fabs there. China just announced a $50 billion government investment into the semiconductor equipment chain to ensure domestic supply of parts and machinery. With Governments around the world bidding against each other, it appears Technology Companies are asking: Government Can You Spare a Billion? And Third, the new GLP-1 drugs for weight loss are creating all sorts of ripple effects. While most research and news articles focus on the negatives, there appear numerous positives that are starting to emerge. Significant weight loss translates into clothes and undergarments that no longer fit. According to numerous articles, those taking the drugs started to refresh their wardrobes with clothes that fit their new bodies. For Retailers, given a Consumer squeezed by Inflation, this stands as a silver lining to the spending clouds they have endured. As a side benefit to Retailers, the Consumer purchases focus on smaller sizes which cost less to produce, but for which the Consumer pays the same price as a larger garment with more fabric. For Retailers, it appears The Skinny Consumer to the rescue.
In Closing
Should you have any questions on how the above issues or the items discussed in our accompanying cover letter impact your family’s financial position or your business’s future as well as the potential actions you could take in response, please do not hesitate to contact us. We welcome the opportunity to discuss this with you.
Yours Truly,

Paul L. Sloate
Chief Executive Officer