Global Economic Quarterly, Part 1: Growing One BRIC At A Time
 Views From the Stream
The Monthly Letter covers two topics this month. First, we provide Part 1 of our Global Economic Quarterly. This month we focus on the growth of the BRIC Initiative and the continued economic growth in much of the Emerging Markets. This contrasts to the EU, which continues to struggle due to fundamental policy choices that impede its ability to deliver strong, long term economic growth. Second, as always, we close with brief comments of interest to our readers on a variety of current topics relevant to the economy and the markets.
Global Economic Quarterly, Part 1: Growing One BRIC At A Time
For those that want to understand where the global economy stands, a simple fact dominates. Emerging Markets continue to grow faster than Developed Markets. There stand two principal drivers of this growth. First, many of these countries continue to put in place both basic infrastructure and build out their industry to supply their own goods. And Second, many Developed Economies chose to follow economic policies that retard their economic growth rate. As a result, according to the World Bank, the Emerging Economies now make up ~60% of Global GDP on a PPP (Purchasing Power Parity) basis. The Developed Economies stand at only 40% and shrinking.
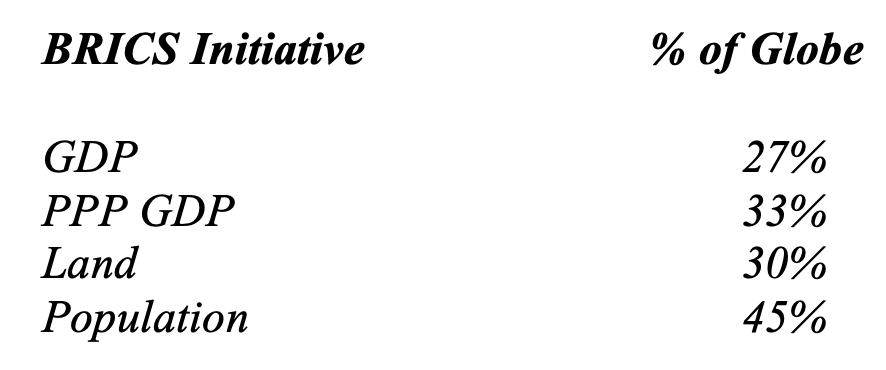
With rising economic clout centered in the Emerging Markets, the BRICS Initiative continues to grow. The original members consisted of Brazil, Russia, India, and China, which founded the BRICS in 2009. They were joined by South Africa a year later. In early 2024, Egypt, Ethiopia, Iran, and the United Arab Emirates (UAE) joined the BRICS. The BRICS members today comprise 30% of the world’s land surface, 45% of the globe’s population, and 27% of Global Nominal GDP. If we adjust GDP for Purchasing Power Parity, PPP, they produce over 33% of Global GDP.
The BRICS Initiative created rival institutions to those founded by the G7 in order to foster and leverage their growing economic power:
- New Development Bank (originally the Asian Infrastructure Development Bank)
- BRICS Contingent Reserve Arrangement
- BRICS Joint Statistical Publication
- BRICS Basket Reserve Currency
Each one of these initiatives deliberately mimics capabilities provided by the G7 in order to supplant and replace the G7 role in the Global Economy. The principal funder behind this initiative, of course, stands China, who continues to position itself to become the dominant economy on a global basis. Part of its global push includes undermining and supplanting institutions such as the IMF and World Bank with institutions that support its Global Geopolitical Goals. With China’s continued rise as a global economic and military power, numerous additional 15 countries have applied to join the BRICS. They include: Algeria, Bahrain, Bangladesh, Belarus, Bolivia, Cuba, Kazakhstan, Kuwait, Nigeria, Pakistan, Palestine, Senegal, Thailand, Venezuela, and Vietnam. Another 16 countries have expressed interest in joining the BRICS, but have not applied yet. These include many countries in Africa as well as NATO member Turkey. To the extent the BRICS Initiative continues to grow, it becomes a major economic counterweight to the G7 institutions, projecting the economic power of the Emerging Economies across the globe. As one might say, Growing One BRIC at a Time.
Dragon Games
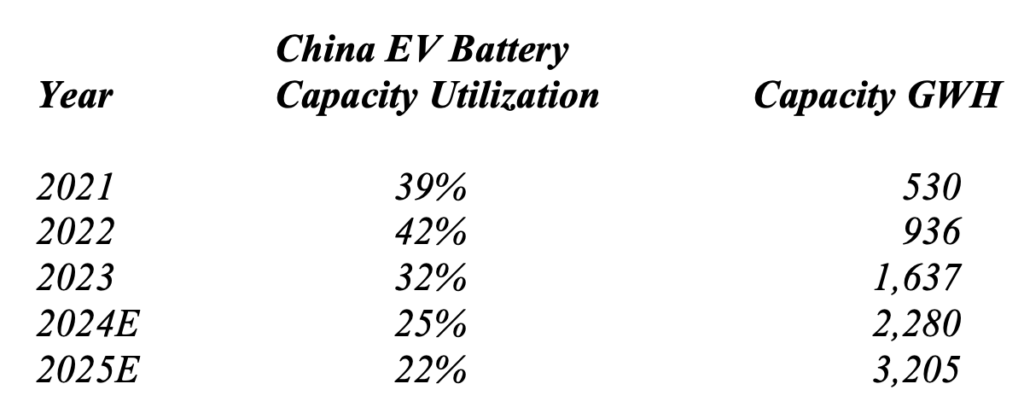
China continues on a path that will put it in rising economic conflict with the West. With domestic difficulties due to a flagging real estate sector and underdeveloped consumer spending, it continues to target global dominance across every industry as a solution to its economic woes, now targeting advanced technology components and products with its mercantilist economic policy. Industrial Investment continues to grow at double digits despite massive overcapacity internally. Two simple examples will make clear China’s push across supply chains and end markets. Despite massive overcapacity in EV Batteries, the country continues to add capacity rapidly. Capacity Utilization fell to just 32% in 2023 from 42% in 2022 and stands on track to fall below 25% in 2024, based on capacity additions in progress.
This contrasts with the US and Europe where EV Battery capacity utilization runs more than twice as high. Despite the massive EV Battery additions, Consumer demand for autos remains steady at ~25 million units per year, where it is projected to remain for the rest of the decade. And while demand for EVs continues to grow as a share of domestic sales, it still leaves massive overcapacity in domestic auto production. To solve this issue, China continues to move down two paths. First, it moved to put foreign competitors out of business in its domestic market. Joint Ventures with foreign auto manufacturers stand under pressure, as China provides economic backing to domestic companies and forces losses on these joint ventures. In addition, to put pressure on Tesla in the country, China began to ban the ability of Tesla cars to access significant parts of the country. This includes not only military bases and government buildings but major city centers, factories, convention centers, and other areas. In effect, China plans to make it unfeasible for the average Chinese citizen to own a Tesla now that it created domestic, home grown EV companies. Second, China’s Auto Exports exploded over the past few years. In 2020, China exported less than 1 million vehicles. In 2023, the country exported over 4 million vehicles. China plans to export 5.4 million units in 2024. In other words, China plans to utilize foreign markets to solve its domestic overcapacity problems and allow the country to continue to grow its Industrial Capacity. In addition to this plan to have other countries solve its overinvestment issue, China utilized these exports strategically, dumping product into Europe to try to put the European EV Manufacturers out of business. Europe responded recently, moving to tariff and ban these exports into the EU. While Western markets stand closed, China continues to drive its export push into Emerging Markets to create a dominant position in those markets.
In the Semiconductor Industry, China invested over $500 billion to date, with another $100 – $200 billion behind it, to take over 25%+ Global Market Share over the decade of the 2020s. This policy focuses on displacing non-Chinese company produced product in all goods manufactured in China and to be sold inside the country. As an example, China banned the use of Apple phones in government buildings. Then the government recently expanded the ban to other buildings and areas of the country. The goal stands to slowly squeeze Apple and other competitors out of the country. In addition to these actions, the Chinese Communist Party’s Made in China 2025 plan includes displacing foreign components in all technology goods exports and grabbing share outside the country for its domestic manufacturers. China already moved to grab Global Share in Passive Components, selling product at a 15%+ discount to foreign competitors to gain share. A similar policy likely will occur as China brings the numerous semiconductor fab plants online over the next few years.
The results of this policy make themselves apparent clearly in China’s Trade Surplus. China’s Trade Surplus grew from $361 billion in 2020 to $910 billion in 2023. China’s 2020 GDP is estimated at ~$16 trillion and its 2023 GDP stands at ~$17.5 trillion. (Note: official data and that from a variety of sources differ on China’s true GDP.) Based on this, exports accounted for ~37% of China’s GDP Growth. However, with Nominal GDP growth of just 3.5% in 2023, Economic Growth likely stood below 2% rather than the 5.2% the government reported. The government got to the 5.2% by revising downward the Fixed Asset Investment in 2022 by 17%, what one might call a “non-trivial” amount. So, assuming that China actually grew its GDP much less than the official statistics on growth, Exports potentially accounted for more than 50% of the country’s economic growth over the past few years. With China playing Dragon Games, economic conflict with the rest of the globe stands poised to explode upward and likely lead to Trade Wars in the not too distant future. (For those seeking more data on China’s economic growth or lack thereof, please see the May 31, 2022 Views From the Stream article: Global Economic Quarterly, Part 2, Scenes From Abroad: A Slowing Dragon & An Elephant Leading The Charge.)
The Sun of the Past
For those wishing to understand Japanese economic policy, they need look no further than economic policy from the 1960s and 1970s. During those decades, Japan re-industrialized its economy and used its undervalued currency to drive Export driven economic growth. In doing so, the country took major global share in steel, autos, and other manufacturing driven areas. That is until its currency was driven upward from 360 Yen to the US Dollar to just 120. Today, a similar policy exists:
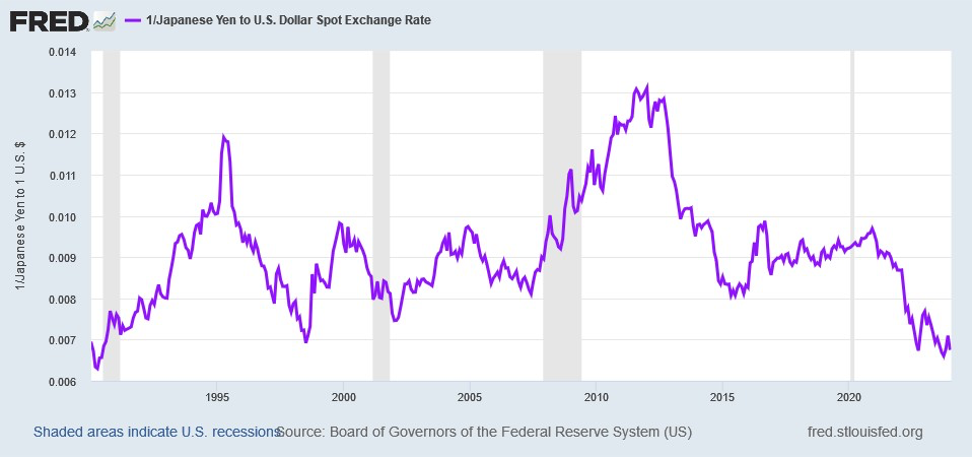
Japan has devalued its currency from 110 to the US Dollar to 150. Excluding the period of overvaluation from 2010 – 2014 and in 1990, the Yen stands 30% below its average value over the past 35 Years and the lowest since 1990. And this devaluation produced the expected economic result. Exports exploded upward as a percent of GDP:
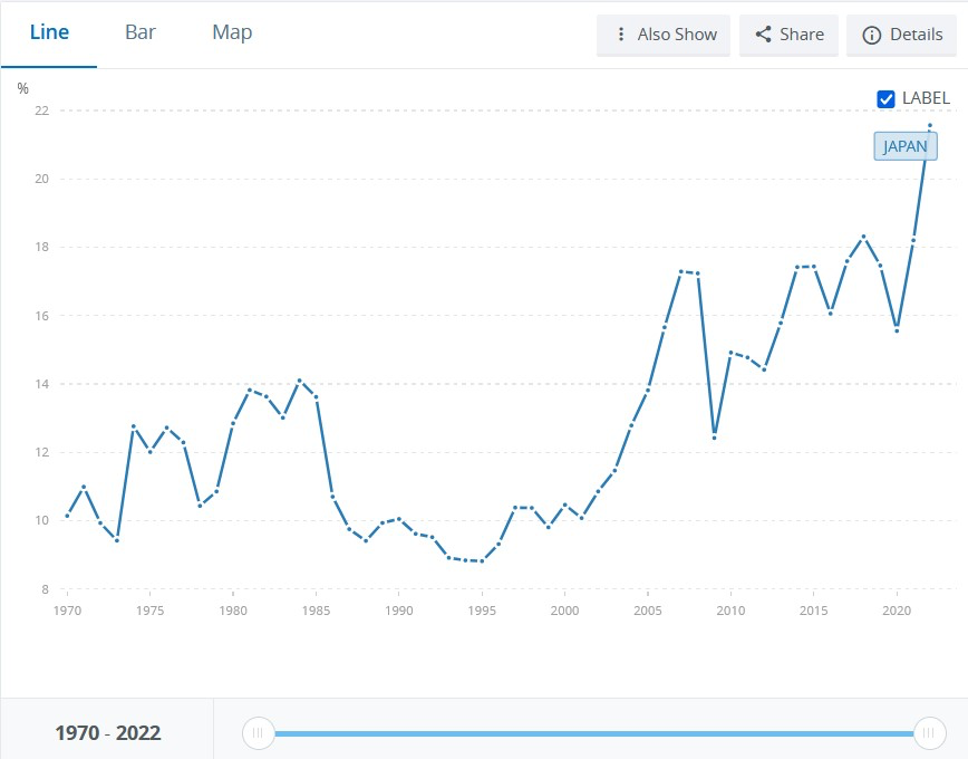
And GDP Growth accelerated:
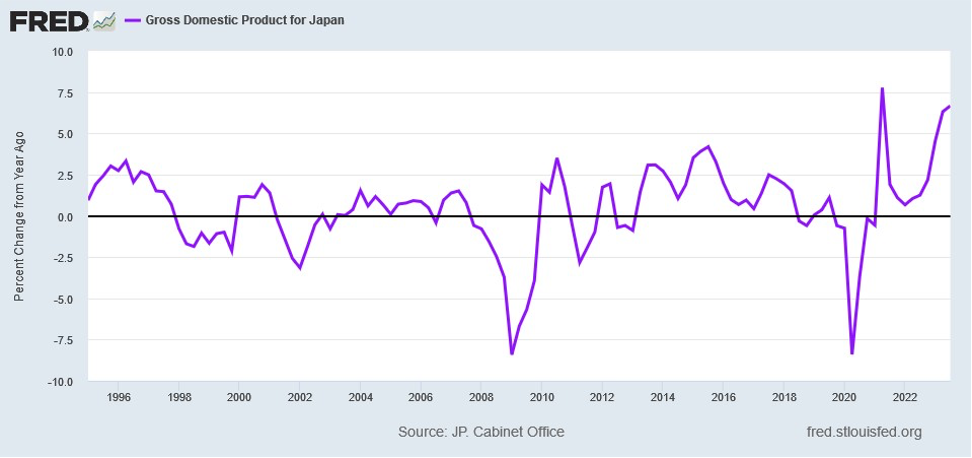
For Japan, this represents a positive change after decades of stagnation. And it also represents a proven method to defend Global Market Share when a country like China attempts to flood the Global Markets with product below cost. Japan effectively just lowered the cost of its products by 30%. Of course, this will work only as long as other countries don’t retaliate in the Foreign Exchange Markets. At least for now, Japan will enjoy The Sun of the Past.
Tiger Goals
For Southeast Asia, development and opportunity continue to drive economic growth. Development continues apace as countries seek to leverage their indigenous resources to gain a greater share of Economic Value Added. In addition, countries seek to grab a piece of the economic pie that China will cede as Western companies move production out of the country. While not quite the 5%+ growth of the last decade, these countries collectively will grow 3% – 4.5% in 2024.
Of course, for Southeast Asia, another goal now continues to rise in their national priorities. How to fend off a China intent on dominating the seas and dictating foreign policy to the rest of Asia? Of course, this answer stands in cozying up to the United States and limiting China’s economic influence on their economies. For a country like The Philippines, this becomes critical with China already circling to gobble up parts of the country and a number of its islands, especially in the South China Sea. With the Marcos family once more in political control, The Philippines renewed its special relationship with the U.S., expanding its Enhanced Defense Cooperation Agreement. The US expanded from 5 to 9 the number of bases in the country in 2023. And the U.S. agreed to work to integrate US forces with the Philippine Armed Forces. And while this stands the most prominent example of defense cooperation, other countries, such as Taiwan, Australia, and Malaysia, have moved to use the U.S. shield to help fend off their expansionist neighbor. For the countries of Southeast Asia, Tiger Goals are changing, as National Security becomes an important strategic consideration.
Elephant Astride
India continues to churn out the best fundamental economic growth in Asia and potentially the globe. Fundamental economic growth continues to exceed 6% driven by industrialization, a turn in the housing cycle, and government infrastructure spending. Reflecting the strong economic growth, Home Prices continue to accelerate to the upside. Home Price growth which stood 2% Year-Over-Year (YOY) in mid-2021, now stands at 11% YOY. Development continues to accelerate. Gross Fixed Capital Formation remains strong at over 29% of GDP. And Non-Performing Loans in the banking system cratered from over 11% in F2018 to just 3.3% in September. Government investment into the economy rose from 1.5% of GDP in F20218 to 3.3% this year, F2024, ending in just two months in March. For those looking abroad, the Elephant Astride continues to lead the charge.
Living La Vida Loca
For Brazil, life appears returning to normal after several years of turmoil. Growth appears set to hit 2% – 3% in 2024 and sustain at that clip beyond. Private sector balance sheets, whether companies or individuals, stand in good shape. This fundamental positive should feed into economic growth providing a higher floor. Corporate Profit Margins stand at their best level since before the 2008 Financial Crisis. This will enable companies to withstand any short term volatility in the economy and increase their investment. Loan to Deposit Ratios stand back to 2009 levels, after peaking in 2015 at rates almost 40% higher than today. This is despite strong growth in private credit and outstanding bonds. Lastly, oil production stands set to grow into the late 2020’s providing a strong source of foreign exchange. For Brazil, it appears once more Living La Vida Loca.
The Old Man Steps Backward
In contrast to much of the rest of the world, Europe stands in Recession. With European Union (EU) monetary policy driven by Germany and focused on avoiding the issues of inflation, European growth continues to underperform the remainder of the globe, as it has since 2009. Except for the period during the Pandemic, when the European Central Bank (ECB) entered into emergency liquidity actions, European monetary aggregates have not sustained growth in excess of 5%:
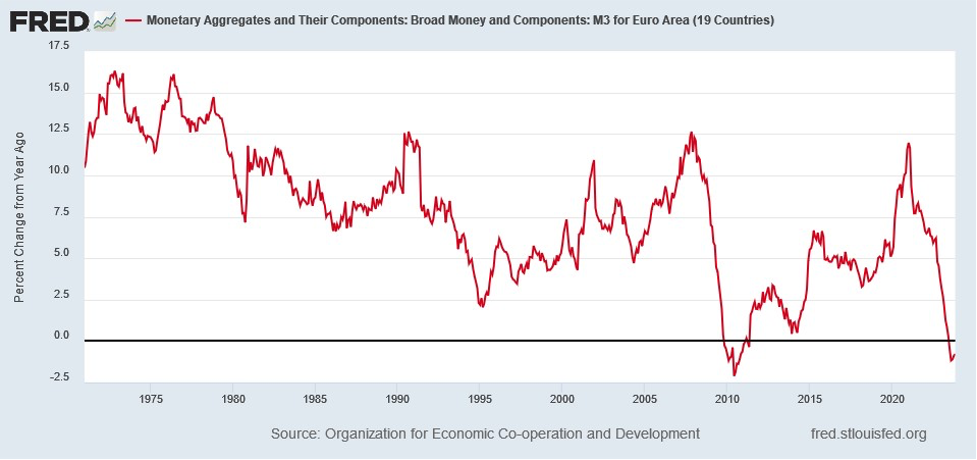
In fact, Monetary Growth came down so much in the late 2013 to early 2014 period that Europe created a double dip for itself after the 2008 Financial crisis. Compounding EU monetary policy, Germany hitched its export growth to China. However, a funny thing happened on the way to economic growth, China enacted Made in China 2025 back in 2015 as official policy. Thus, it moved to displace high value European exports with domestic manufacturing. And it moved to export goods back to Europe, recently dumping both Electric Vehicles and Solar Panels below cost into the EU market. In Q4 2007, EU GDP totaled €2.9 trillion. However, in Q4 2023, EU GDP totaled just €3.34 trillion as the following chart demonstrates:
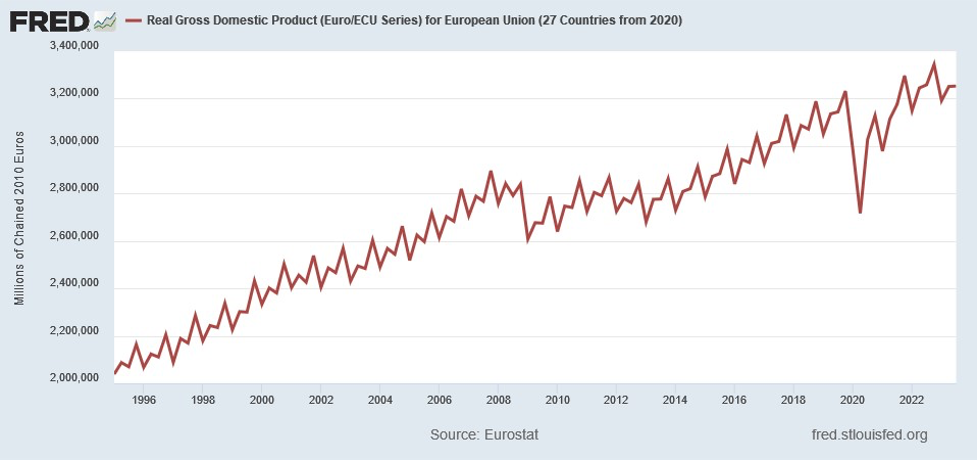
This means that over the past 16 years, EU GDP grew a mere 15.3% or just 0.9% compound over the entire period. For the average European, this produced a poor result. Another way to view this growth is in US Dollars. When viewed in this manner, EU GDP Growth looks as follows:
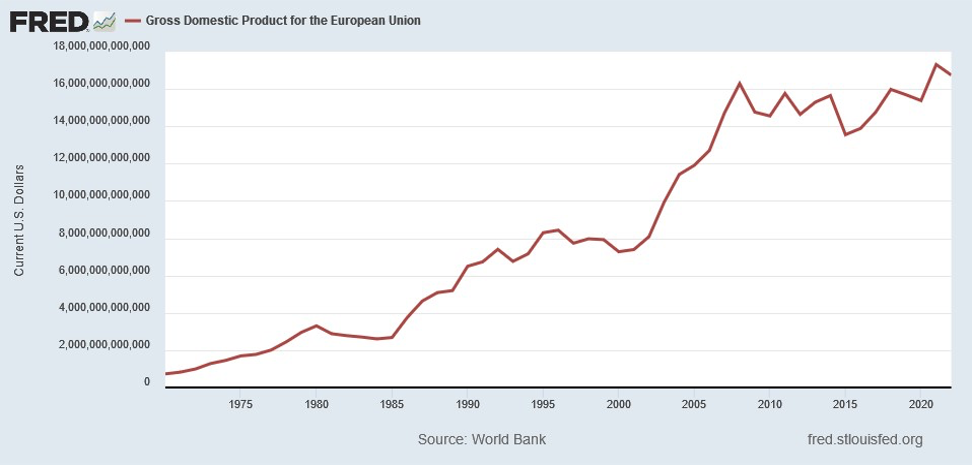
When viewed in this manner, EU GDP grew just 2.8% from 2008 to 2023, a truly disastrous result. Only if the EU rebalances its economy will anything change. With pressures from immigration, the Southern European countries using the threat of departure to gain investment, and continuing pressures due to the moves by China to displace European exports, The Old Man stands in a difficult place. Outside forces couple with policy continue to force it to Step Backward, which will only step up the political pressures to fundamentally change policy and focus on economic growth.
To RV or Not To RV, Cement Shoes, and Running Man
Finally, we close with brief comments on To RV or Not To RV, Cement Shoes, and Running Man. First, unit volumes for RV sales have collapsed. According to Winnebago Industries, the largest manufacturer of RVs in the United States, RV deliveries fell more than 31% in their Q4 ended November 25 with backlog declining over 68%. For Americans, it appears that after the RV craze during the Pandemic, To RV or Not To RV, that is the question. Second, prices on Cement continue to rise at a rapid rate. After rising 12.3% in 2023, they are expected to rise an addition 7% – 9% in 2024. For roads and building construction budgets, this represents a set of Cement Shoes, driving costs upward and profits downward. Third, Nike reported a drop in Q2 sales in North America, ended in November 2023, fell 5%. Wholesale Revenues fell 9%. For Nike, the question is: Where did the Running Man go?
In Closing
Should you have any questions on how the above issues or the items discussed in our accompanying cover letter impact your family’s financial position or your business’s future as well as the potential actions you could take in response, please do not hesitate to contact us. We welcome the opportunity to discuss this with you.
Yours Truly,

Paul L. Sloate
Chief Executive Officer