Global Economic Quarterly, Part 1: What Happens When 60 Central Banks Tighten At Once? A Slow Motion Train Wreck
 Views From the Stream
The Monthly Letter covers two topics this month. First, we provide Part 1 of our Global Economic Quarterly. Over 60 major Central Banks around the world adopted a tightening focus over the past 12 months. The only major exceptions consist of Japan and China, each for their own internal reasons. These 60+ Central Banks adopted this bias to combat Inflation caused by the consumer demand explosion engineered by governments in response to the Pandemic and the ensuing Supply Chain bottlenecks. Layered on top of this government created Inflation stands Energy. With the rise of ESG, governments discouraged traditional, carbon-based Energy investment over the past five years. This produced, with a lag, a slowing in Supply growth. Despite the move to EVs and non-carbon electricity generation, traditional Energy demand continues to grow globally. As a result, rising demand met constrained supply growth producing a rise in Energy prices. This exacerbated the government induced Inflation issue. Central Banks continue to respond to this Inflation boogeyman by raising rates and draining reserves from economies around the world in order to slow demand growth and raise unemployment. The inevitable result stands ahead in the form of a Global Recession in 2023 while watching this play out is like watching A Slow Motion Train Wreck. While this will address the short term Inflation issue, it will not solve the underlying issue of underinvestment into Energy. Nor will it address the need for governments to inflate themselves out of the debt they created to combat the Pandemic. As always occurs when the economic growth going gets tough, governments resort to currency depreciation to grow their economies at the expense of other countries. As the non-depreciating governments respond to the depreciating countries’ attempts to siphon off global growth to their benefit, the world likely will experience another bout of Currency Wars. Second, as always, we close with brief comments of interest to our readers on a variety of current topics relevant to the economy and the markets.
Global Economic Quarterly, Part 1: What Happens When 60 Central Banks Tighten At Once?
A Slow Motion Train Wreck
“Each industry when prosperous buys and consumes the produce probably of most (certainly of many) other industries, and if industry A fail and is in difficulty, industries B, and C, and D, which used to sell to it, will not be able to sell that which they had produced in reliance on A’s demand, and infutre they will stand idle till industry A recovers, because in the default of A there will be no one to buy the commodities which they create. Then as industry B buys of C,D, &c., the adversity of B tells on C, D, &c., and as these buy of E, F, &c., the effect is propagated through the whole alphabet…As has been explained, the fundamental cause is that under a system in which everyone is dependent on the labour of everyone else, the loss of one spreads and multiplies through all, and spreads and multiplies the faster the higher the previous perfection of the system of divided labour, and the more nice and effectual the mode of interchange.”
Chapter VI: Why Lombard Street Is Often Dull And Sometimes Excited
Lombard Street – A Description of the Money Market
By Walter Baghot, 1873
For those watching Central Banks and their impact on the Global Economy, not much changes over time. There appears merely a repeat of cycles seen over and over again, stretching back to the 1600s. The first Central Bank came into existence in 1668 via the Swedish Riksbank, whose original name was Riksen Standers Bank. Its formation occurred after the failure of the Stockholms Banco, which issued the first true banknotes in Europe. Unfortunately, the Stockholms Banco issued banknotes that were not backed by coin. As the bank issued more and more notes, their value depreciated quickly. Thus, when depositors demanded their money in coin by turning in their banknotes, the bank experienced a classic run on the bank leading to failure. The Riksens Standers Bank charter from the government sought to remedy the issues that led to the Stockholms Banco failure by requiring gold, silver, and copper coins and banning the issuance of banknotes. In addition, the charter required the bank to focus on price stability or “to maintain the domestic coinage at its right and fair value”. (Please see the Riksbank website at https://www.riksbank.se/en-gb/about-the-riksbank/history/historical-timeline/ for a full historical accounting.) Only 26 years later, in 1694, the UK Government created the Bank of England (BOE) as a joint stock company to purchase the government’s debt. The BOE founding charter gave it the duty to fund the government and the ability to issue coins and banknotes with implicit government backing. And the banknotes needed to be backed by silver, thus the banknote came to be known as the Pound Sterling. But the BOE also stood a private company focused on generating profits, by taking deposits from other banks. In other words, the BOE became the banker’s bank. Thus emerged these banks central role in the financial system and their nom de plume, Central Bank. But unlike today’s Central Banks, these early banks protected themselves and the gold and/or silver standard above all else as they were tasked with price stability. Thus, they precipitated economic crises whenever their interests conflicted with that of the economy. When financial stress in the economy occurred, due to crop failures, large defaults, or wars, instead of lending to their correspondent banks to meet their needs, they would turn away their correspondent banks, effectively bankrupting them. This, of course, created panics on a regular basis. For example, this created panics in the UK in 1825, 1837, 1847, and 1857. Thus, Central Banks did not fulfill one of their core functions of today, that of lender of last resort. This only emerged in the late 1800s in the UK, when Walter Baghot, a well-known economic writer of the times, proposed the “Responsibility Doctrine”. This doctrine required the BOE to subsume its interests to the interests of the overall economy. This doctrine ultimately became one of the key tenets for other Central Banks around the world and came into play during the 2007 – 2009 Financial Crisis. Thus, most Central Banks possess two key goals: lender of last resort in a financial crisis and price stability the rest of the time. (The U.S. Federal Reserve stands an exception as it possesses a third mandate of economic growth.)
With the massive rise in Inflation in 2021 coupled with the strong recovery from the Pandemic, Central Banks turned their focus to the mandate for price stability. This typically begins in Emerging Markets (EM), where Inflation tends to occupy a central position and currency issues come into play, which are then followed by Developed Market (DM) Central Banks. Given its central role in the Global Financial System, the U.S. Federal Reserve typically leads the major DM Central Banks in acting either to loosen or tighten policy. With Inflation roaring to heights not seen since the 1970s, the political pressure rose on the Federal Reserve to address Inflation. And act it did. The Fed raised rates 2.50% in just six months with another 0.75% occurring in September, which brought the Discount Rate to 3.25%.
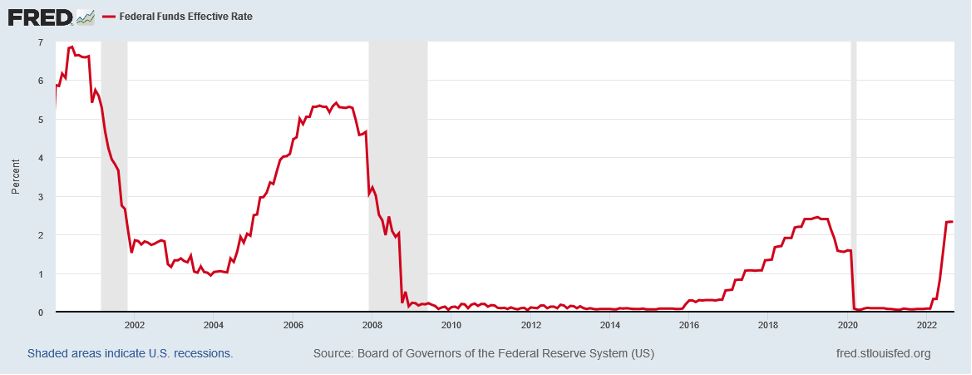
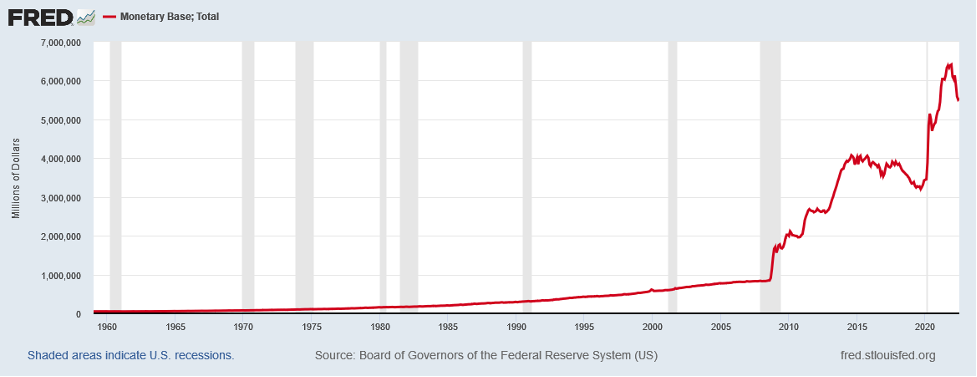
This rate level stands the highest level since 2008, when it was lowering rates to fight the recession and before that to 2006. Should the Federal Reserve act as indicated over the next six months, rates would reach 4.50%, close to their peak in 2007. In addition to the aggressive rate increases over the past seven months, the Federal Reserve entered into Quantitative Tightening or QT as it is known. Under this policy, the Fed removes money from the economy, shrinking the Monetary Base, as the following chart demonstrates:
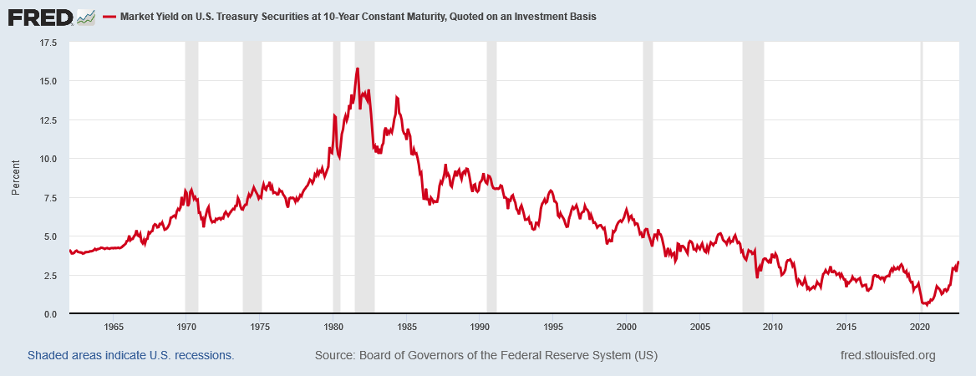
This action typically impacts a broad range of financial levers in the economy. It already impacted long term financing for companies and consumers in a significant way. The 10 Year Treasury Yield now stands at 2010 – 2011 levels:
And, as many borrowings are priced at a spread to a specific Treasury maturity, these yields moved up significantly as well. Mortgage Rates stand one of the most impacted. Late in 2021, 30 Year Mortgage Rates stood less than 3.00%. Today, rates hover above 6.00%:
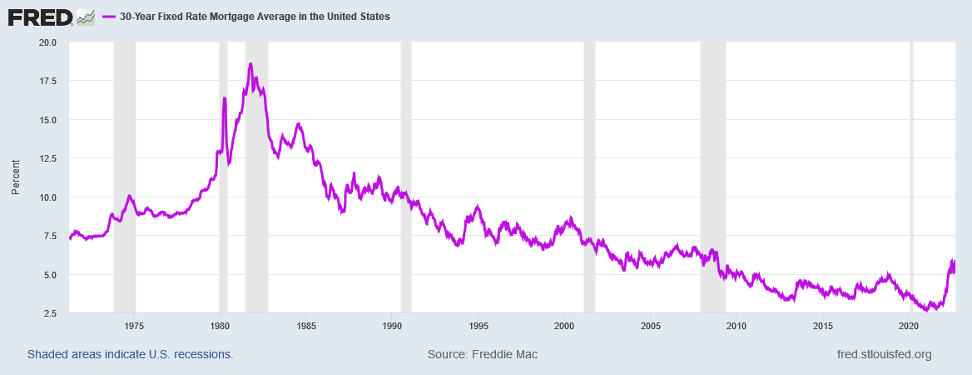
The 30 Year Mortgage Rates have not been this high since the 2004 – 2008 time period.
Of course, the rise in Interest Rates impacts the economy with a lag, typically 6 – 12 months. One of the most sensitive areas to Interest Rates stands housing. When the Federal Reserve drove Mortgage Rates below 3.00%, Housing soared, with prices levitating at a rapid rate, as the Case Shiller Index demonstrates:
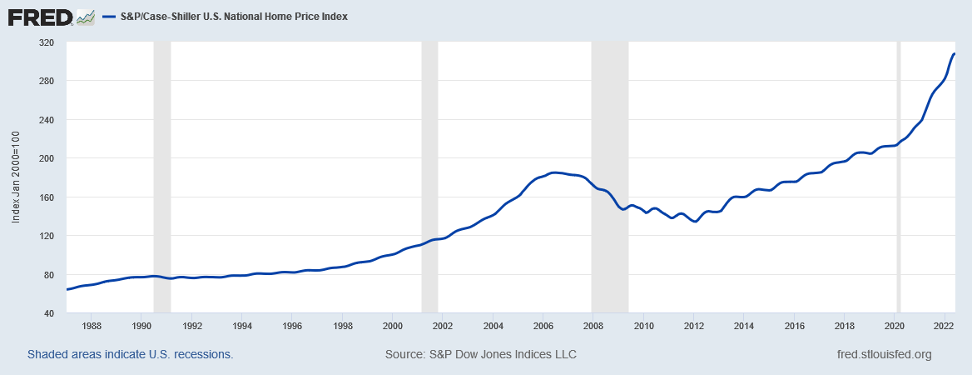
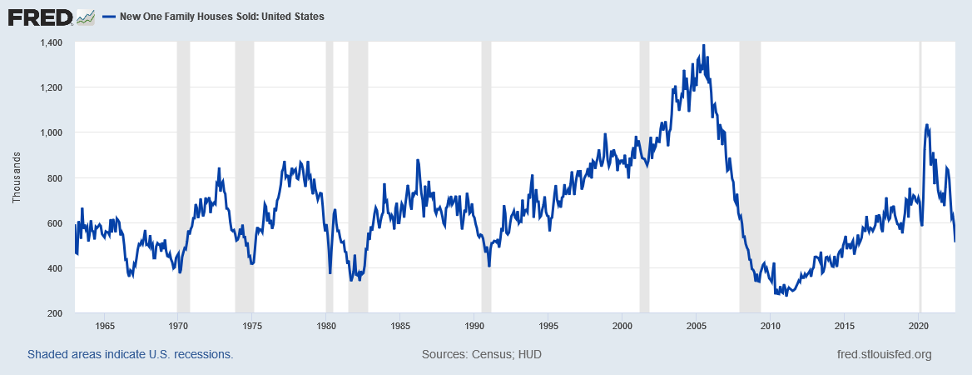
Prices rose at the fastest rate since the 2005 – 2007 period, during the Housing Bubble. Of course, with the recent rise in Mortgage Rates, transactions have plummeted, as the following graph of New Single Family Homes Sold shows:
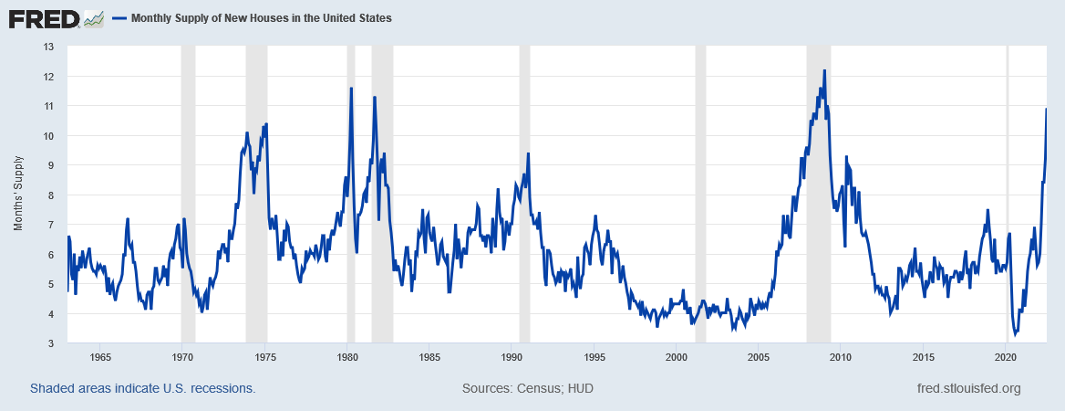
And with homebuilders caught flat footed with homes under construction, Months Supply of New Housing soared in Q2 and Q3, driving them to Recession levels:
Of course, with Inventories rising, Housing Starts are plummeting. According to the US Census Bureau, New Residential Single Family Starts, which peaked at 107,400 in March fell to just 75,200 in July, or by 30% in just 4 short months. (Please see the New Residential Construction release by the Census Bureau at: https://www.census.gov/construction/nrc/pdf/newresconst.pdf .) With a home taking 9 – 12 months to construct, the economic impact won’t fully be felt until sometime in Q3 2023.
Another area coming under pressure due to the rise in Interest Rates stands Autos. While Auto Sales stood under pressure due to the semiconductor shortage, that shortage no longer impacts Autos, except in a minor way. US production of automobiles and light trucks now stands above its level in 2019. Unfortunately, demand, which began to recover in late 2021 as autos became available, took a hit as Interest Rates rose:
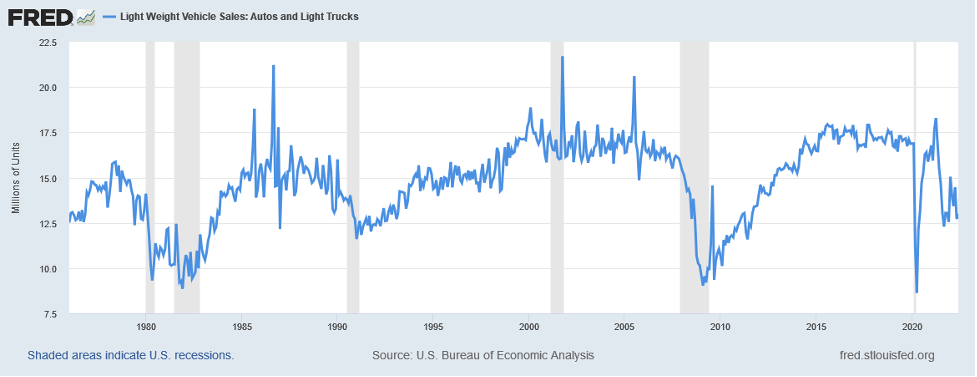
Recent data from companies as diverse as Ford, CarMax, and Tesla confirm this downturn. With the drop in demand and the recovery in auto production, Days of Inventory began to rise over the past few months. While dealer inventories have yet to normalize, they should do so at some point in the next few months. Once this occurs, given the anemic demand, auto production should come under pressure, as dealers pull back on orders.
With the Federal Reserve slowing the economy, there are a number of warning signs that abound. With the Consumer stretched by Inflation among basic items such as food, gasoline, heating, electricity, …, pressure continues to rise on other areas of spending. The easiest way to see this is Retail Inventories, ex- Autos and Parts.
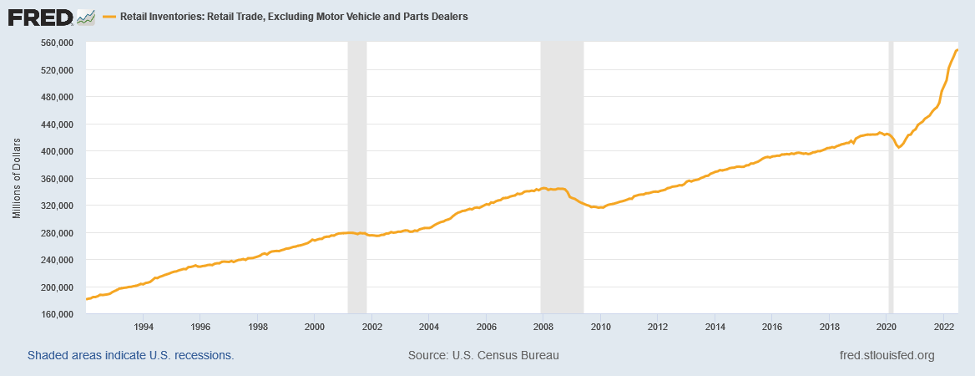
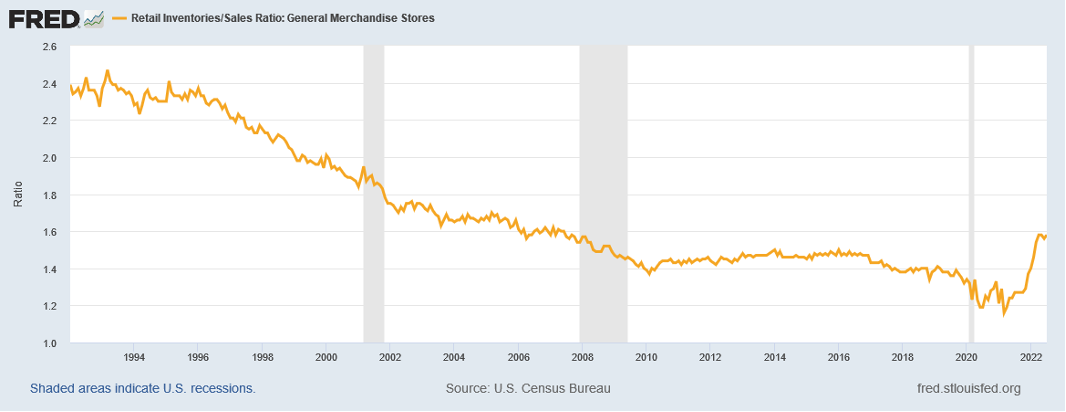
As the graph demonstrates, Inventories have soared. And when normalized on either a GDP basis or on a Sales basis, they have soared as well, since the Federal Reserve began its tightening campaign:
Nike recently stated it’s US inventories stand 65% above last year. If one thinks that all of this does not bode well for the economy, the critical indicators of the economy’s health continue to flash Yellow turning to Red. The key leading indicator for the economy stands the Yield Curve. This comes in two flavors, a long lead indicator and a short lead indicator. The long lead indicator began to predict a Recession earlier this year:
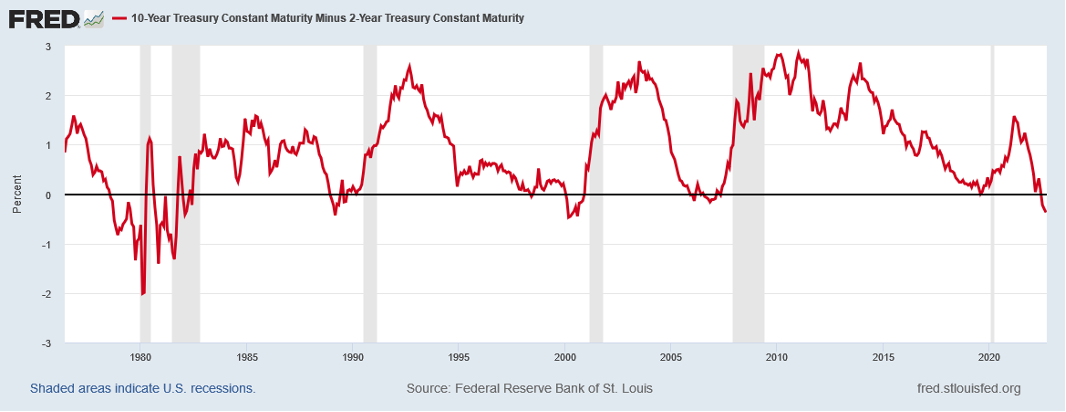
As the above indicator shows, when the line dips below zero, it stands time to batten down the hatches before the storm arrives. The short leading indicator stands poised to turn negative as well:
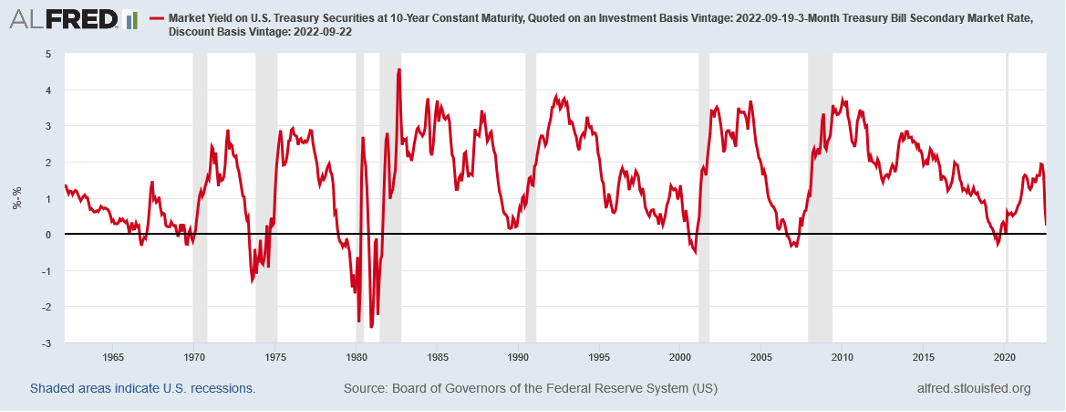
As of September 20, after the recent Federal Reserve rate increase of 0.75%, the indicator stands barely positive at +0.16%. With the Federal Reserve expected to raise rates by 0.50% or more at the next FOMC Meeting in early November, this indicator should turn negative as well. That would indicate a Recession would begin sometime within 6 – 9 months or late Q2/ early Q3 2023. Clearly, for business, it stands time to put out the hurricane lines on the ship.
While the above are clear impacts from the rise in Interest Rates, there exist numerous impacts that do not appear quite so obvious. The biggest one concerns the US Dollar. With the Federal Reserve tightening policy well ahead of other Developed Market Central Banks, the value of the US Dollar soared over the past year, hitting new heights:
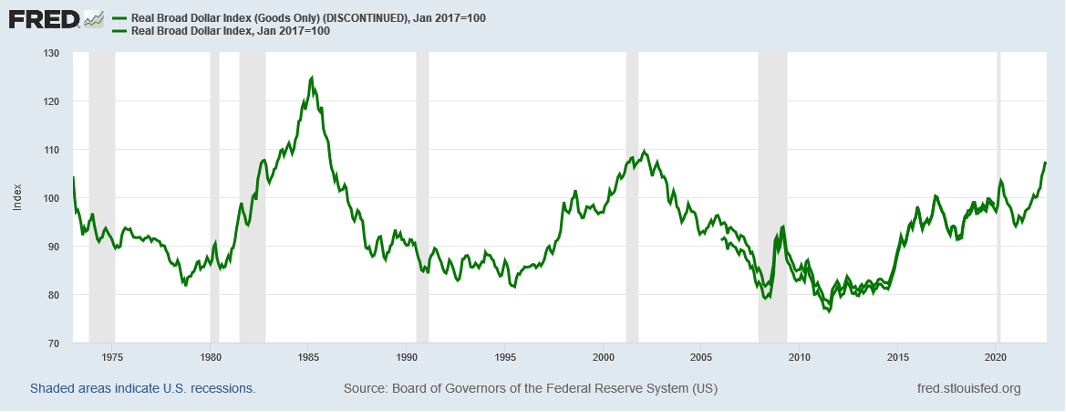
As the graph makes clear, the US Dollar continues to approach the heights last seen in 2001 and before that in 1986. For the US Economy, this represents an additional drag on economic growth. For every 10% rise in the US Dollar, US GDP Growth experiences a 1% negative impact in the following year, Year 1, and a negative 0.5% impact in Year 2. This drag would come on top of the headwinds created by the Federal Reserve for the economy.
The history of the Federal Reserve and other Central Banks fighting Inflation stands long and simple. The Central Bank simply raises rates and pulls money out of the economy until something breaks. Usually, what breaks is the economy. Sometimes what breaks is a financial institution, the financial system, a sector of the economy, or a foreign country. Given the global economic backdrop, it appears that the Federal Reserve will break the US Economy this time. With plenty of warning, given their public pronouncements, watching the US economy over the next year becomes similar to watching a movie where the trains are headed towards each other on the same track and time slows down so the audience can watch A Slow Motion Train Wreck in all its gory detail. For that clearly lies ahead for the US Economy. And in this case, it appears neither train will slow to lessen the impact on manufacturers. retailers, consumers, construction companies, or any other part of the economy. And with the US Economy critical to the Global Economy, wreckage will fly across the Globe, impacting economies from Brazil to China to South Africa to Sweden. Thus, the Federal Reserve will lead Central Banks across the Globe into the cycle repeated over and over again since the 1700s. By focusing on “price stability above all else”, they create an economic crisis. And as Unemployment rises and Economies sink, they face the political reality of needing to subsume their interests to the economy and adopting the “Responsibility Doctrine” once more. For the Global Economy, it will be, in the immortal words of William Shakespeare, written in 1598: “Once more unto the breach, dear friends, once more; or close up the gap with the English dead” as King Henry V uttered to his troops as they besieged the city of Harfleur in France prior to their march to Calais and victory at Agincourt. (Data from Federal Reserve of St. Louis coupled with Green Drake Advisors analysis. For those noting the slight discrepancy in two data series for the US Dollar in the graph above, it relates to the Federal Reserve discontinuing one series and starting another with slightly different weights for foreign currencies in the respective series. Please see the following link to the St. Louis Federal Reserve Economic Database: https://fred.stlouisfed.org/searchresults/?st=Trade+Weighted+US+Dollar&pageID=1 for the various US Dollar Indices available from the Federal Reserve. And for those looking for the full speech written by William Shakespeare, please see his play Henry V, Act III, Scene 1, where King Henry V rallies his troops during the battle for Harfleur, France.)
The Grocery Squeeze, Getting Cloudy Outside, and Doctor Copper
Finally, we close with brief comments on The Grocery Squeeze, Getting Cloudy Outside, and Doctor Copper. First, consumers continue to face significantly higher prices at the grocery store. Whether it is General Mills’ Cheerios, Campbell Soup’s Clam Chowder, or Nabisco’s Chips Ahoy, prices are up 15% or more on everything the consumer buys. This is leading to negative volumes for all the major packaged foods companies as consumers are forced to live within their means. For the packaged food companies, it is The Grocery Squeeze. Second, capital spending expectations for major cloud service providers continue to drop. After growing at 25% – 30% this year, cloud service provider spending is expected to slow to less than 10% in 2023. For the technology providers, it is Getting Cloudy Outside. And Third, prices of Copper have fallen significantly this year after returning to their 2011 heights last year. With the red metal one of the best indicators on the health of the global economy, business owners and investors should pay heed to the message that Doctor Copper continues to send.
In Closing
Should you have any questions on how the above issues or the items discussed in our accompanying cover letter impact your family’s financial position or your business’s future as well as the potential actions you could take in response, please do not hesitate to contact us. We welcome the opportunity to discuss this with you.
Yours Truly,

Paul L. Sloate
Chief Executive Officer