Global Economic Quarterly, Part 2: What If China’s Growth Truly Slows?

From 2000, when China entered the WTO, until 2020, when the Pandemic commenced, China accounted for almost 50% of all global growth. This enabled the country to leapfrog from a small but growing economy to the world’s #2 Economy today. For the Global Economy, China became the “Little Engine That Could”, climbing the mountain and turning itself into a Big Engine in doing so. For countries that hitched a ride, it drove their economies forward. Initially, this drove growth in the commodity exporting countries, as China grew its industrial economy and urbanized the country. It needed gobs of iron ore, alumina, copper, magnesium, and other basic commodities. As it initially followed the classic Emerging Market industrialization path, it generated commodity intensive growth. This drove China to become the largest factor in many of these commodity markets by 2010. Following closely, starting in 2012 – 2015, China focused on higher value industrial and technology. This meant its growth became dependent on these higher value inputs. Thus, countries that manufactured the subcomponents benefitted as China moved to compete in high end areas. This included much of Southeast Asia. Using its “Indigenous Innovation”, or what the rest of the world would call IP Theft, coupled with massive state subsidization of its industry, China grew its overall industrial base and exports massively over the past decade. Today, exports alone total more than $3 trillion. With another estimated $4 trillion in industrial production for the domestic economy, Chinese industry comprises $7 trillion of its ~$17+ trillion GDP.
In addition, China urbanized the country. It went from less than 30% urbanized in the 1990s to over 64% urbanized today. In order to house all these people, China’s real estate markets grew massively and became another key driver of the economy. With a population of 1.4 billion people today, to build enough housing for 35% of the populace, 490+ million people required housing. To build this massive amount of housing took significant steel, concrete, gypsum, … requiring significant buildout of the supply chains that fed into the construction markets. Today, real estate related construction or Fixed Asset Investment (FAI) directly accounts for 15% – 20% of China’s GDP with the supply chain to produce all the products needed to support the industry making up another 10%+ of the Chinese economy. All told, real estate construction comprises 25% to 30% of the economy today. Lastly, China embarked on a massive infrastructure buildout. This included a highway system, railroads, ports, sewage, electricity, and every other basic portion of the economy. China poured more concrete in the past 20 years than the US did in the past 100 years. This fell under the rubric of Fixed Asset Investment (FAI) and comprised another 20% – 25%+ of China’s growth.
While China continues to attempt to pivot towards Consumption, there is a long road ahead. This is due to its income per capita and the gap it needs to close. And despite clear manipulation of its economic statistics and the move towards “Common Prosperity” to bolster consumer incomes and ultimately Consumption, the issues confronting its economy can no longer stay buried underneath the proclamations from above. Investment or FAI traditionally drove over half of China’s GDP growth. This half of China’s GDP faces secular issues across all facets of the economy. And this secular slowing in over 50% of its GDP growth will force a major adjustment on the Chinese economy and those countries that have built their economic models to leverage China’s development course over the past 20 years.
First, China built out every major industry in its economy over the past 20 years. This ranged from basic steel to the manufacture of solar panels. In the past 5 years it targeted the remaining high value industries where Chinese companies did not have a major global share. These included industries such as Medical Equipment, Biotech, Semiconductors, LEDs, and other key areas. With China having built all its basic industry, significant capacity in intermediate industrial goods, and now high technology industries, the ability to build out new industries to drive future growth stands limited. With Manufacturing FAI representing over 30% of Total FAI, this sector faces serious headwinds.
Compounding this issue, China faces serious issues on trade for the first time since the 1990s. Under President Donald Trump, the U.S. recognized the Chinese threat to its core technology advantage and manufacturing base. Consequently, the U.S. put in place tariffs on Chinese goods. Despite calls by the Fortune 1000 to remove these tariffs, the U.S. government continues to apply these tariffs with little sign of relief for China. This stands especially true given China’s lack of compliance with the Phase 1 trade deal. Despite Chinese excuses and platitudes, the reality of not complying with a deal to which they agreed to adhere, with the President of The United States, makes future trade deals difficult, if not impossible. In addition, given the developing geopolitical and technology competition, the U.S. continues to add to its forbidden entities list numerous Chinese technology companies. This action effectively bans these companies and their products from doing business with the U.S. and its allies. In addition, due to the Pandemic, China made a huge global market share grab in medical equipment and other areas shut down by governments abroad. This led to China’s Global Export Share rising over 2% to 15.2%, when compared to pre-Pandemic levels of 13.3%. What is interesting is that China’s exports took off the minute it became clear that Donald Trump no longer would occupy the Presidency. In fact, exports rose over 30% in 2021, hidden by the noise of the Pandemic. However, with the U.S. facing an election, China’s actions will come to the fore, leaving the current Administration little room to relax any constraints. With exports at over 15% of China’s overall GDP, when examined on a gross basis, and representing over 40% of its Industrial Economy, this area likely will face considerable headwinds for the foreseeable future.
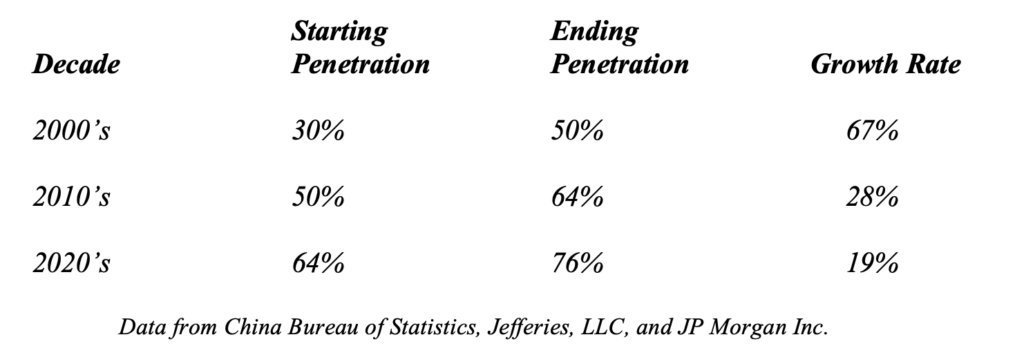
Second, Real Estate faces secular headwinds, unlikely to disappear until well into the 2030s. This is driven by both the decelerating pace of urbanization and demographics coupled with massive overbuilding in the past 10 years. With China’s urbanization already at ~64%, growth cannot look the same as the past. Going from 30% to 64% over two decades represents over 100% growth and helped drive real estate in the top cities across the country. However, going from 64% to 76% urban produces only 19% growth. The following table makes clear what the Law of Large Numbers implies for future growth over the next decade:
In addition to the above, the mix of purchasers changed over the past decade. According to data from China’s National Bureau of Statistics, over 85% of all new units purchased in 2010 were purchased by those who would occupy the units and only 15% by investors or as second homes. However, by 2020, this mix changed dramatically, with investors/ second homes comprising over 85% of all new units purchased and owner occupiers only 15%. In other words, China’s Real Estate market grew only because investors continued to buy units. Unfortunately, this switch in demand levers drove troves of empty but completed units across the country.
Compounding this shift are demographics. China’s population growth continues to slow. This follows naturally from the “One Child Policy” and the rising Income Per Capita. China, to limit population growth, implemented the One Child Policy in order to ensure it would not outgrow its ability to feed its population. With this policy in place, China now faces an aging population with its elderly population, 60+ years old, expected to grow from 280 million today to 450 million in the next 20 years. This will occur as population growth continues to approach zero, with the population expected to start to shrink later this decade. Several outside data sources estimate that China’s Housing Demand peaked in 2017 and fell by almost 20% by 2020. It is expected to drop by another 20%+ by 2030 to a level 35% – 40% below its level in 2017. This represents a significant long term drag on the Chinese Economy.
To put these numbers into perspective, at 25% – 30% of China’s GDP, Housing represents $4.4 – $5.2 trillion in economic output that will see shrinkage over the next decade. This will impact not only the direct inputs used in building structures, but all the infrastructure that goes with development including roads, sewer, electricity, and water. Chinese statistics indicate real estate related Investment accounts for 20% – 25% of FAI. For some industries, this drag will represent a long term cloud that just won’t go away. A look at the Chinese steel industry illustrates the issues facing the country:
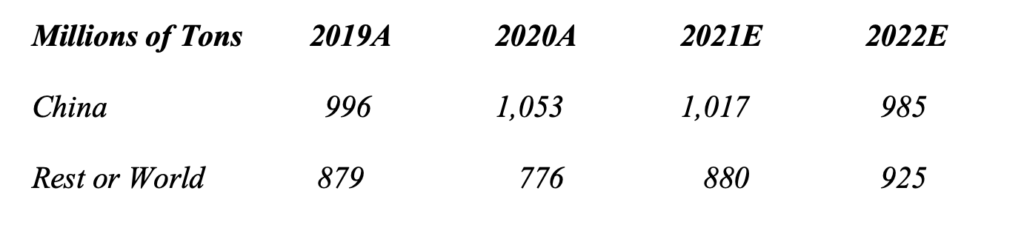
Data from World steel Association coupled with Green Drake Advisors estimates. The data can be found at:
https://www.worldsteel.org/media-centre/press-releases/2021/October-2021-crude-steel-production.html
Long term projections, show the steel industry shrinking through 2030. While China will attempt to step on the infrastructure accelerator, as it often does to solve its economic growth issues, the ability to create a positive long term economic impact, as opposed to filling a hole, will become harder and harder. Already the country publicly indicated that it will accelerate infrastructure investments in H1 2022. While this will help to stabilize economic growth over the short term, given the massive amounts spent over the past decade, finding projects that actually will provide long term contribution to economic growth will swirl around this investment. And given that China already built out its highway system, rail system, airports, ports, shipyards, electric grid, …, actually earning a ROI on this investment likely will prove elusive.
Projections for Chinese growth continue to slow. This appears inevitable given the above fundamental economic forces. The following chart provides updated data for China, since originally published in August, and the second chart adds some consensus economic projections for 2022:
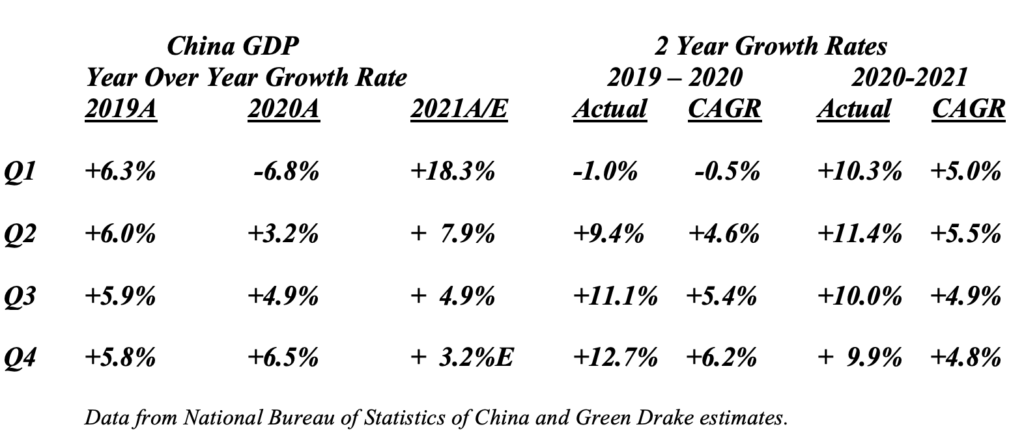
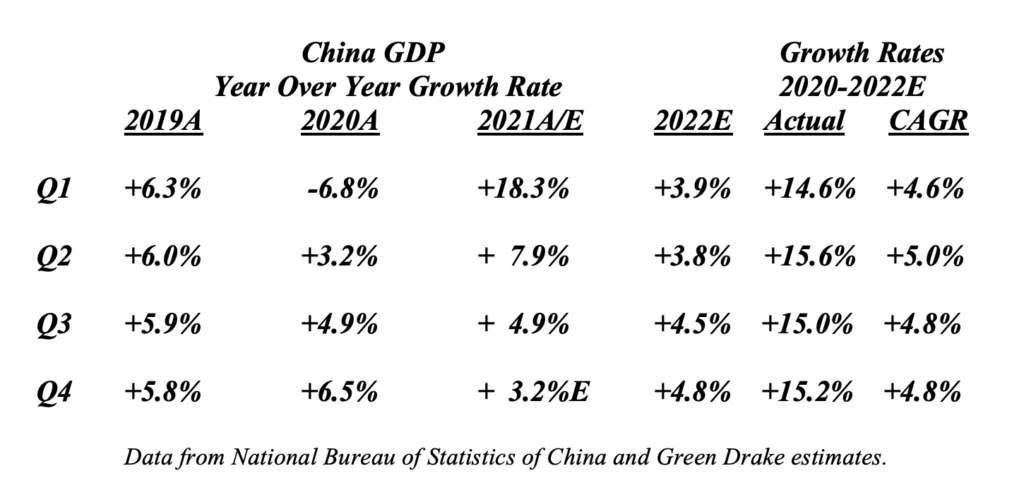
Based on current projections, China will struggle to grow at 4.5% in 2022, let alone the 5.0% – 5.5%+ growth the country targets. And with growth highly back end loaded, much will depend on government stimulus and government mandated credit growth.
For the Rest of the World, the reality of China’s transition to a sustainable GDP Growth level will come as somewhat of a rude awakening. Applying metrics used to understand potential growth in more mature economies indicates the chasm between China’s target of 6%+ GDP Growth for the past decade and the sustainable reality. And it brings into question its current target of 5%+ going forward. With a Population Growth of 0.5% or less and Productivity Growth of just 0.6% per annum, consistent with the International Monetary Fund’s Productivity calculations for China over the period from 2012 – 2019, then China’s sustainable growth would equal just 1.0% – 1.1% per year. This type of analysis remains points out the chasm between the level of sustainable growth and the actual growth China exhibited. It also explains why China’s Debt to GDP rose more than GDP over the decade long period from 2010 – 2020, as capital returns plummeted.
For the Communist Party, this type of growth deceleration would prove disastrous. It indicates the scale of the problem the government faces in trying to maintain 5%+ growth when one view of the fundamentals would indicate a much lower sustainable level. If China’s actual growth recedes to just 4% by 2025, a not unreasonable thought given the fundamental slowing in Real Estate, Industrial Investment, and Infrastructure, the ramifications for how the Global Economy grows stand tall, overshadowing all else. The following illustration demonstrates the math that results and the ramifications across the globe. Should China’s growth slow to 4% or less and the US return to its traditional growth of 3%+ per annum, easily achieved should the US become serious about manufacturing the products it consumes once more, then each would achieve a similar amount of growth over the next decade, with the US retaining its size advantage. This would change the balance of power in how the global economy grew, with China and the US contributing equally. And if Europe carries out its massive investment program, it too will accelerate its growth on a fundamental basis. Thus, instead of contributing over 50% to Global Growth, China could see its share drop to less than 20%, in this simple illustration. Should China’s growth drop to 3% while US growth accelerated above 3%, then all bets are off. The US, due to its larger starting size, would pull away, gaining share of Global GDP.
This above analysis excludes some key Emerging Markets poised to continue relatively strong growth. This includes portions of Southeast Asia as well as much of Africa. For example, India’s economy, which rebounded strongly in 2021, stands in a position to take the Global Growth lead. Current projections show the country delivering almost 9% GDP Growth in 2022, followed by 5% – 6% growth in 2023. With ~$3 trillion in GDP for 2021, India will contribute almost $275 billion to Global Growth in 2022. However, according to the IMF, India’s Currency PPP (Purchasing Power Parity) is 23 Rupiah/US Dollar compared to its current exchange rate of 74 Rupiah per US Dollar. This means PPP GDP approximates $9.5 – $10.0 trillion. That means India’s real contribution to 2022 Global GDP could total $800 – $900 billion compared to $1.1 trillion for the US and less than $900 billion for China. Indonesia delivered ~$1.150 trillion in GDP in 2021 while Malaysia reached almost $350 billion. Combined they produced $1.5 trillion in GDP last year. Indonesia will grow over 5% in 2022 and Malaysia close to 10%. This means the two countries combined will contribute $75 – $100 billion to 2022 GDP. If we add in more mature areas, such as Europe, the diminished role of China’s growth contribution to Global Growth becomes even more stark. The EU’s GDP is estimated at $16 trillion, while the rest of Europe contributes another $7 trillion. Economic projections show the EU growing 4.5% in 2022 and the remainder of Europe, ex-Russia, growing at 5% or better. Combined, they will contribute almost $1 trillion to Global Growth in 2022. If we put this all together in tabular format, the picture appears as follows:
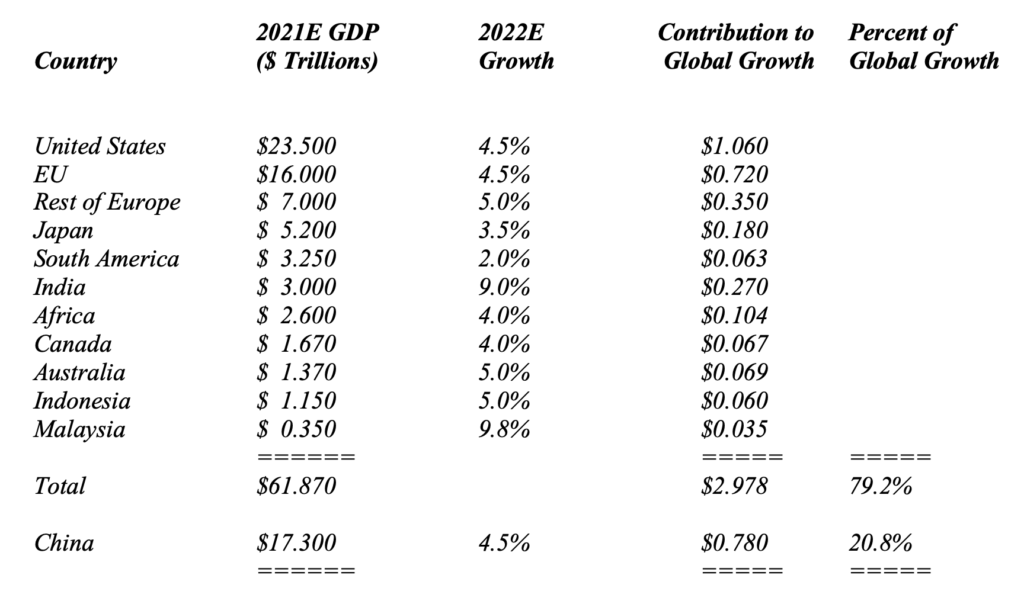
Data from IMF and Trading Economics (www.tradingeconomics.com).
For countries around the globe that assumed China’s economy would remain the dominant force over the next decade, such considerations would need a major rethink. Global Growth appears destined for a period of more even growth, with no one country dominating the narrative. For China, the window to dominate the economic narrative continues to close. For the rest of the world, growth will come from the policies followed by each government and the ability of those governments to drive their country forward. Regardless, the world of the 2020s will be a very different place from that of the 2010s and 2000s. Given the reality of China’s economy and the fundamentals it faces over the next decade, the question on each country’s top policymakers’ minds and in every company Board Meeting should be: What If China’s Growth Truly Slows?
Confidential – Do not copy or distribute. The information herein is being provided in confidence and may not be reproduced or further disseminated without Green Drake Advisors, LLC’s express written permission. This document is for informational purposes only and does not constitute an offer to sell or solicitation of an offer to buy securities or investment services. The information presented above is presented in summary form and is therefore subject to numerous qualifications and further explanation. More complete information regarding the investment products and services described herein may be found in the firm’s Form ADV or by contacting Green Drake Advisors, LLC directly. The information contained in this document is the most recent available to Green Drake Advisors, LLC. However, all of the information herein is subject to change without notice. ©2020 by Green Drake Advisors, LLC. All Rights Reserved. This document is the property of Green Drake Advisors, LLC and may not be disclosed, distributed, or reproduced without the express written permission of Green Drake Advisors, LLC.