Global Economic Quarterly, Part 1: A Trip Down Memory Lane To Those 1970s Swinging Disco Days And To Those 1940s Crooners

Hey, hey, hey, hey, hey
Macho, macho man (macho man, yeah)
I’ve got to be a macho man
I’ve got to be a macho, macho man, yeah
I’ve got to be a macho, ow!
Macho, macho man (yeah)
I’ve got to be a macho man
Macho, macho man (hey, hey)
I’ve got to be a macho
Macho Man
By Morali Jacques and Belolo Hen
Recorded 1978 by The Village People
For the Global Economy, the last two years appear A Trip Down Memory Lane, as Western governments resorted to pump priming and monetary printing as one. These actions, as in prior recessions, lifted the Global Economy out of its Pandemic induced funk, driving Global GDP to new heights. What differed this time around stood the magnitude of the stimulus, which prevented the normal collapse in goods demand that occurs in a recession, despite the massive rise in unemployment. As a result, Global Goods Demand soared. Central Banks, in a repeat of their late1960s and 1970s actions, continued to add copious piles of money, throwing fuel on the proverbial fire. With a small lag, the normal problems emerged in 2021, including goods shortages and late 1960s/early 1970s inflation. With monetary authorities realizing that inflation can no longer be hidden under government manipulated statistics, they moved belatedly to end the massive monetary accommodation put in place to combat the Pandemic. This modus operandi consists of the “Tapering” underway by Central Banks, such as the Federal Reserve and Bank of England, and traditional monetary tightening in the form of interest rate increases put in place by Central Banks such as Norway, Uruguay, and New Zealand. In addition, some Central Banks, such a the Royal Bank of India, began to remove money from their economy to combat the inflation caused by their prior actions.
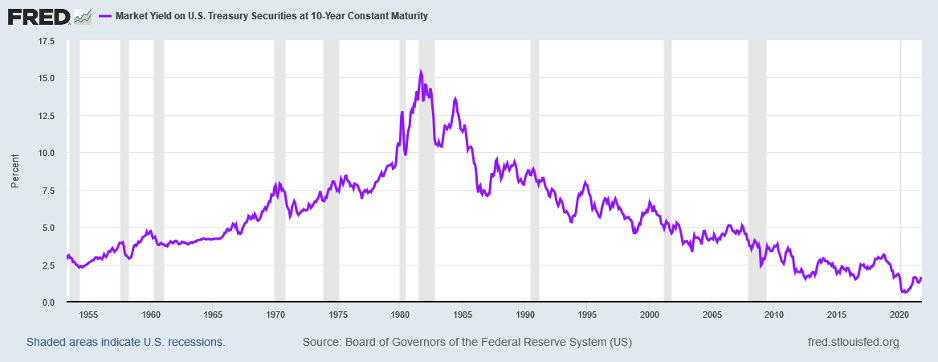
While the closest analogy to Central Bank policy stands the 1970s Swinging Disco Days for those alive today, a bygone era may prove a better vantage point from which to view the current economic situation. This era of the 1940s and 1950s Crooners spans both World War II and the Korean War, a point in time when the government needed to fund large deficits, then inflate the real value of government debt away. A review of the data from the Consumer Price Index (CPI), 10 Year Treasury Note Yields, Moody’s AAA Corporate Bond Yields, and Real Rates will illustrate why the 1940s appears the more apt analogy for today’s economic environment. The following graph lays out US interest rates since 1953:
And the following chart lays out the CPI since 1919:
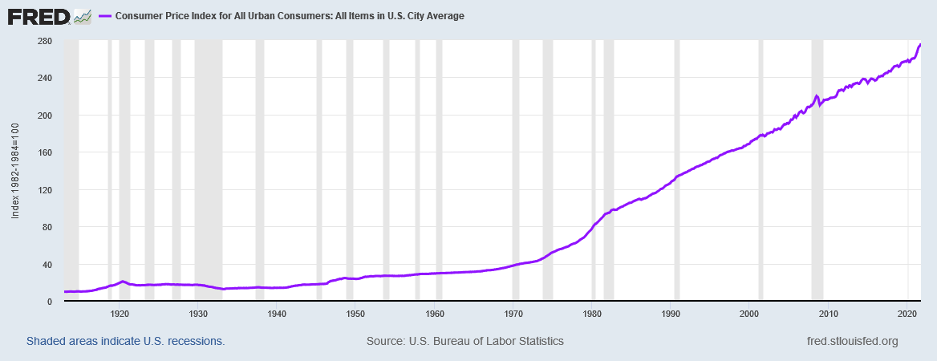
As the CPI graph makes clear, the rate of change of the CPI drastically accelerated after President Nixon took the US off the Gold Standard in 1971, which helped enable the massive inflation during the 1970s. The following graph makes clear how Inflation accelerated in the 1970s:
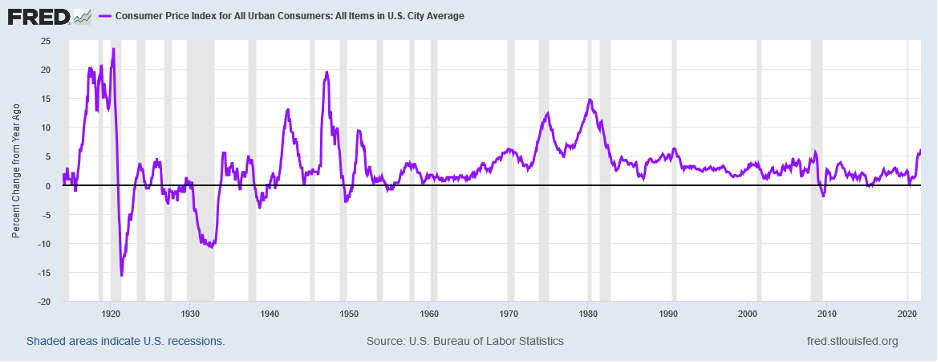
However, that merely put inflation back at levels seen during the 1940 – 1955 period and from 1916 – 1920, which both overlapped a World War and the normal inflation after a major conflict. Given the average American’s experience during the 1940s and 1950s, Interest Rates rapidly responded to the rising levels of Inflation in the 1960s and 1970s. The following chart overlays the two since 1953:
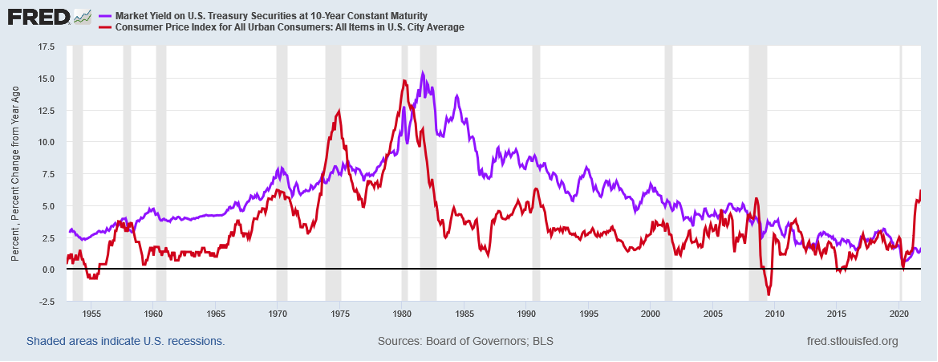
As is clear, Americans demanded a premium in Interest Rates over Inflation to protect themselves against the US Government’s tendency to use Inflation to solve its debt problems. The following chart of Real Rates makes this clear:
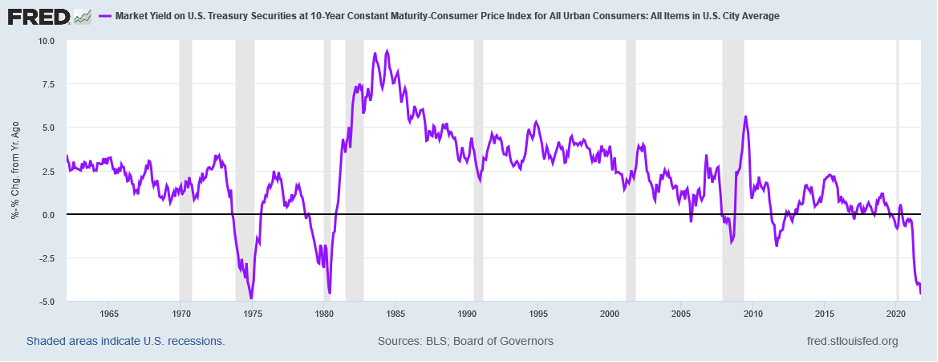
As the chart illustrates, except for 2 periods in the 1970s, when Interest Rates chased Inflation, rising from ~6% to 15%, Real Interest Rates stayed positive. And once Paul Volcker broke the back of inflation in the wrenching recession from 1980 – 1982, Real Rates remained quite positive until 2011, when the Federal Reserve embarked on Quantitative Easing (QE), a monetary policy last used in the 1930s and 1940s. The easiest way to see the similarities is through examination of the St. Louis Adjusted Monetary Base during the relevant historical periods. The first graph covers 1918 – 1960:
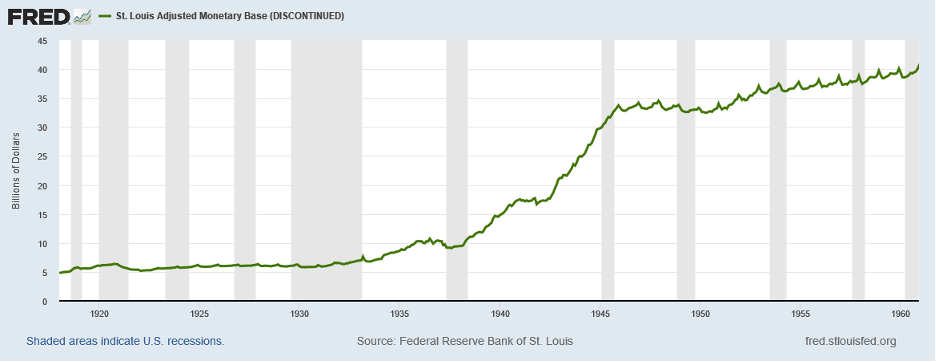
From 1930 – 1946, the Monetary Base grew 5.5x, leading to the war time and post-war time inflation. Then the Base grew at a modest rate until 1960, totaling just 19% over those 14 years, producing the low inflation 1950s. Then the growth took off again:
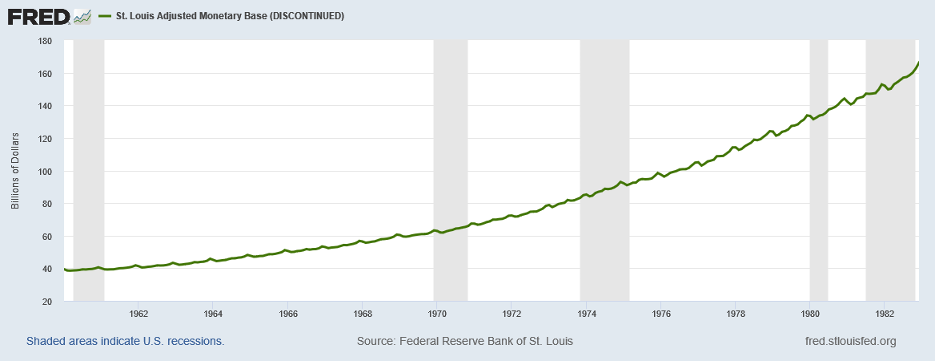
While this appears a steady rise, the Monetary Base actually grew at different rates during this period. During the 1960s, growth accelerated to 60% for the decade. This stands high relative to the 1950s, but not at wartime levels. Then money grew 3x in the 1970s, more than during the 1940s rate of 2.3x. No wonder Inflation took off again in the late 1960s and the 1970s. And Time magazine published its famous cover showing the US Dollar in 1980 worth only 1/3 of its 1970 level.
If we fast forward to today, the graph does not look like the 1970s, with its steady and accelerating rise, but looks eerily similar to the late 1930s and 1940s:
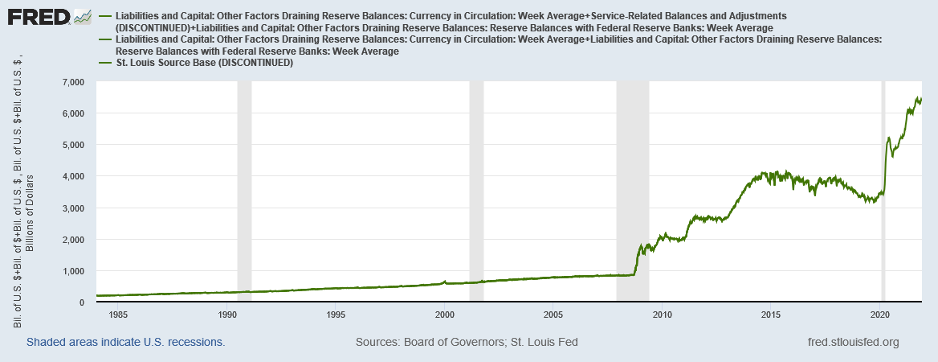
In fact, the Monetary Base grew 7.6x since September 2008. This exceeds its growth from 1930 – 1945. Should anyone wonder that Inflation took off?
This brings back the question of Interest rates. Unfortunately, there did not exist 10 Year Treasury Notes in 1940. However, there did exist Corporate Bonds and Moody’s. The following graph shows the Moody’s Seasoned AAA Corporate Bond Yield since 1919:
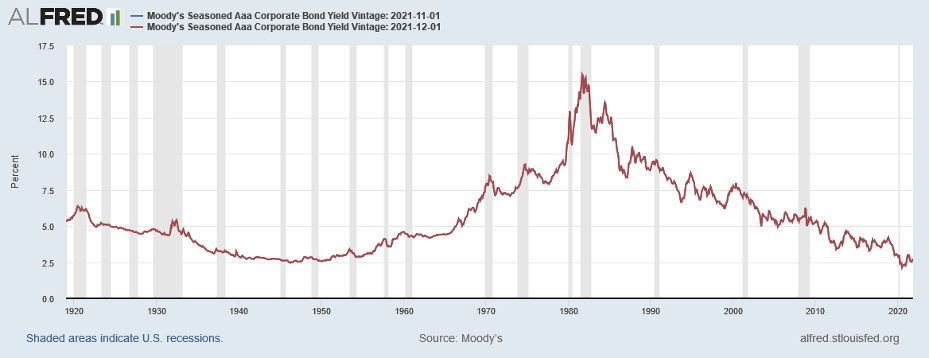
As the graph shows, Corporate AAA Bond Yields stand at a level last seen during the 1930s and 1940s. And the following chart compares these Yields to CPI Inflation:
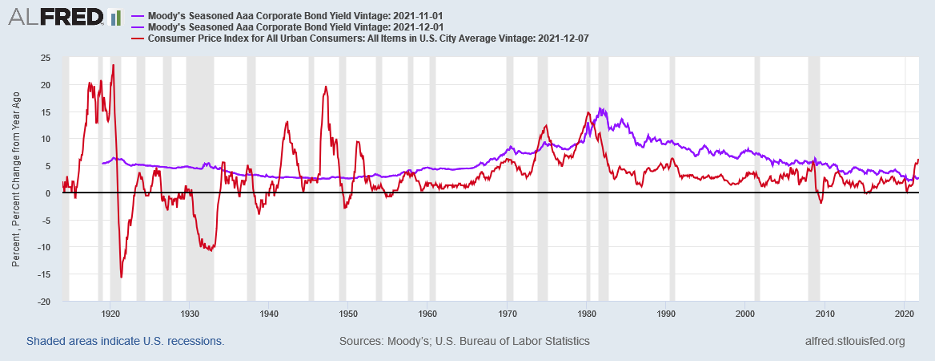
In the 1940s and 1950s, Inflation rose well above Yields as the Federal Reserve controlled Interest Rates to enable the government to monetize its debt. This contrasts with the 1960s and 1970s when rates rose to compensate investors for the massive Inflation. The following graph illustrates this difference using the Real Corporate Bond Yield, comparing AAA Bonds to CPI Inflation:
With the US Government needing to fund large deficits and to simultaneously inflate away the value of the debt, the setup looks much closer to the 1940s and early1950s than the 1970s. And when adding in the actions of the Federal Reserve to massively expand the Monetary Supply while simultaneously controlling Interest Rates using QE, the analogy grows stronger.
With a potential war ahead, it remains unlikely the Federal Reserve will change its policies anytime soon, regardless of the image it wishes to project to the markets. These actions will allow Inflation to surge while simultaneously holding Interest Rates low. For those holding bonds, it will prove a difficult time as the real value will shrink. And Interest Rates, just as in the 1940s, will not adjust to the reality of Inflation. But the Negative Real Interest Rates will stimulate the economy enabling faster growth and aiding the Federal Government’s Quest to monetize its debt. Instead of hearing Those 1970s Swinging Disco Days and the Village People’s Macho Man, investors will hear a very different tune. This tune will rise with the melodious sounds of Those 1940s Crooners. And in the immortal 1949 song performed by Perry Como, the words will ring:
Some enchanted evening, you may see a stranger,
You may see a stranger across a crowded room,
And somehow you know, you know even then,
That somehow you’ll see her again and again.
Some Enchanted Evening
South Pacific
Lyrics by Oscar Hammerstein II
And Richard Rodgers, 1949
Confidential – Do not copy or distribute. The information herein is being provided in confidence and may not be reproduced or further disseminated without Green Drake Advisors, LLC’s express written permission. This document is for informational purposes only and does not constitute an offer to sell or solicitation of an offer to buy securities or investment services. The information presented above is presented in summary form and is therefore subject to numerous qualifications and further explanation. More complete information regarding the investment products and services described herein may be found in the firm’s Form ADV or by contacting Green Drake Advisors, LLC directly. The information contained in this document is the most recent available to Green Drake Advisors, LLC. However, all of the information herein is subject to change without notice. ©2020 by Green Drake Advisors, LLC. All Rights Reserved. This document is the property of Green Drake Advisors, LLC and may not be disclosed, distributed, or reproduced without the express written permission of Green Drake Advisors, LLC.