EVs and CLECs, Same Difference: La Plus Ca Change La Plus Ca Meme Chose

“John Bull can stand many things, but he can’t stand two percent.”
Lombard Street: A Description of the Money Market
By Walter Bagehot, 1873
For those wishing to understand today’s Equity Markets, a quick trip down memory lane to the 1800s stands in order. The famed British Financial Economist, Walter Bagehot, who also edited The Economist, famously made the above comment when discussing the London Stock Exchange. What he meant by his comment went as follows. When the Bank of England drives interest rates down, it creates massive speculation and resource misallocation. Why? Because if money costs nothing, then people will borrow to speculate and to put in place capital assets that would not pass muster in a normal interest rate environment. Walter Bagehot saw this occur over several cycles in the UK. Thus, he warned of the excesses that such interest rates can bring. And he was proven correct over multiple economic and stock market cycles since then.
With Global Central Banks driving interest rates to 0.0% or even negative, rates stand at once in a generation levels that encourage high valuations and investing in marginal assets. In fact, interest rates stand below those seen during the Great Depression. In such an environment, it stands no wonder that valuations rival those seen in 1929 and 2000.
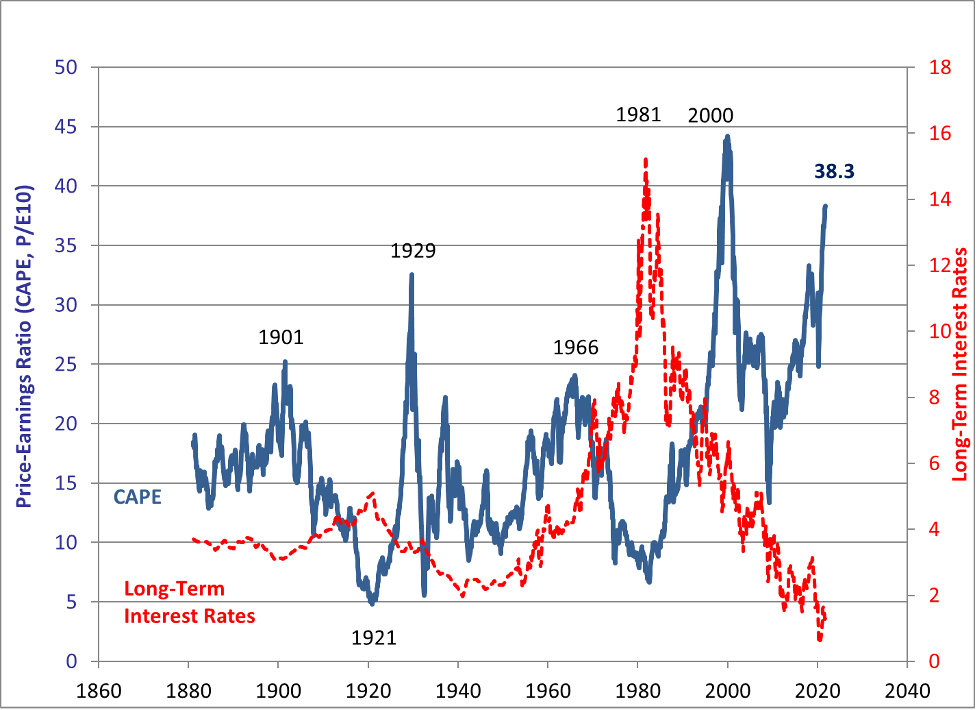
As the above chart makes clear, Equity Valuations stand in rarified air. And, as the chart also makes clear, these valuations exist for brief moments in time, much as the flowers of spring. They also usually occur due to some transformative technology. In the 1920s, it included the automobile, electricity, radio, and appliances. In the 1990s, it included the buildout of the Internet, the digitalization of the phone system, and the rollout of advanced computers across the economy. In both cases, this pushed investors to bring multiple years of growth into the valuation of public companies. Today, the 5 largest names in the S&P 500 trade at 8.2x Revenue with a total valuation of $9 trillion. This valuation exceeds 3x the Market Capitalization of the entire Russell 2000 Index today.
The most striking aspect of the current market stands in the resemblance of EV company valuations to those of the CLECs during the 1999 – 2000 runup. CLECs, the shorthand for Competitive Local Exchange Companies, became the darlings of the late 1990s. These companies stood ready to displace the traditional phone companies, such as AT&T and Bell Atlantic (now known as Verizon). Using new technology, they would undermine the traditional phone companies, making them obsolete. Early entrants into this area, such as Time Warner Telecomm, proved the model could work and that new competitors could take market share from the traditional telecom providers. However, in the period from 1999 until the peak of the market in 2000, numerous early-stage CLECs came public at huge valuations. When you added up the market share they needed to create a viable business, these new companies would need over 100% of the market to succeed. This was in addition to the 100% of the market that the traditional phone companies and existing public CLECs already possessed. In other words, for all these companies to succeed, the market would need to double overnight, a patently unrealistic outcome. However, these companies received enthusiastic reception from investors, sporting massive valuations in their IPOs and seeing their stocks then soar. This provided them the initial capital they needed for their businesses. Unfortunately for this crop of companies, investors soon realized that there did not exist enough phone lines to go around. And the public markets cut off the capital spigot. Once these companies ran through their initial capital, yet still required much more capital to finish their buildouts and reach profitability, the game was over. No money to sustain operations meant bankruptcy and liquidation for much of the industry in the early 2000s.
This cautionary tale appears applicable given the valuation of EV (Electric Vehicle) companies today. Tesla stands the early leader in EVs and the current market leader in independent EV sales. The company’s valuation now exceeds $1 trillion. Other EV companies recently announced plans to go public. This includes companies such as Rivian Automotive, which plans an IPO which would award the company a $55 billion valuation and bring in net proceeds of $9.6 billion, according to CNBC. They would join Fisker, Lucid, and Lordstown Motors as public companies. A quick look at the market valuation of these companies compared to the traditional automotive manufacturers reveals similar characteristics to those seen in the earlier era of CLECs. As the table below illustrates, the valuations reflect investor expectations these companies will completely displace the existing auto companies:
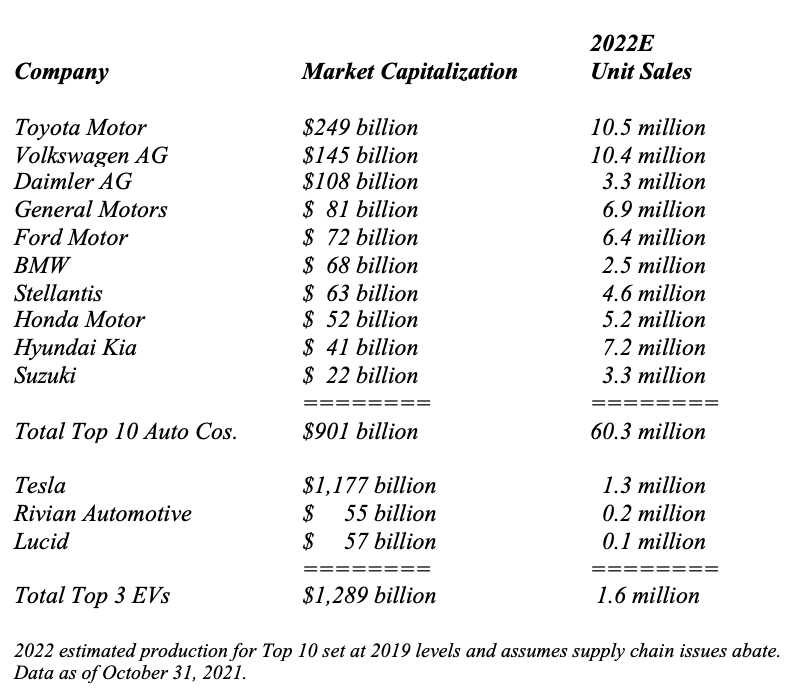
Tesla’s valuation alone stands more than 30% above the combined valuation of the Top 10 Western Auto Manufacturers. Rivian and Lucid, with minimal production in 2022, find themselves valued above all but the 7 largest auto companies. Combined, their valuation exceeds that of the Top 10 by 43%. Yet their combined total production stands less than 3% of the volumes that traditional car manufacturers will produce. In the first half of 2021, while Tesla delivered 386,000 EV units, Volkswagen delivered 332,000 EVs. In 2022, Ford plans to deliver 80,000 electric F-150 Trucks, up from none in 2021. In Europe, combined EV volumes for both BEVs (Battery Electric Vehicles) and PHEVs (Plug-In Hybrid Electric Vehicles) should reach 2,100,000 units in 2022, all from traditional car manufacturers. Unbeknownst to most EV investors, Volkswagen could deliver more EVs than Tesla next year. Yet, the valuation of Volkswagen AG stands just 12% of the valuation of Tesla. Given this data, it appears EVs and CLECs, Same Difference.
In addition to EV valuations and those of the Large Cap Growth Stocks, fundamentals support other portions of the public markets outperforming these Large Cap growth Equities. First, Small Cap Earnings continue to grow at a faster rate. Small Cap Companies will grow earnings 42% this year compared to just 26% for their Large Cap brethren. Despite Small Caps outperforming Large Caps through the end of October, they only stood in the 14th Percentile of Relative Valuation. Value Equities continue to look attractive. Value Equities earnings growth will reach 47% compared to just 34% for Growth Equities in 2021. Their estimated earnings growth in 2022 will also exceed that for Growth Equities if the US economy grows just at a 3% rate. Should the economy grow at 3.5% or 4.0%, Value Equity Earnings Growth will vastly exceed that for Growth Equities. Such an outcome seems likely if the U.S. Congress passes just the Infrastructure legislation. If the Congress passes the Social Spending bill as well, growth likely will exceed 4.0%, potentially reaching 4.5% – 5.0%. Yet Growth Equities trade at a large premium to the market. This large premium becomes clear when viewing the current S&P 500 Price to Sales in historical context compared to its values over the past 30 years. The current value of this ratio vastly exceeds the peak in 2000 and is consistent with the Shiller CAPE data above:
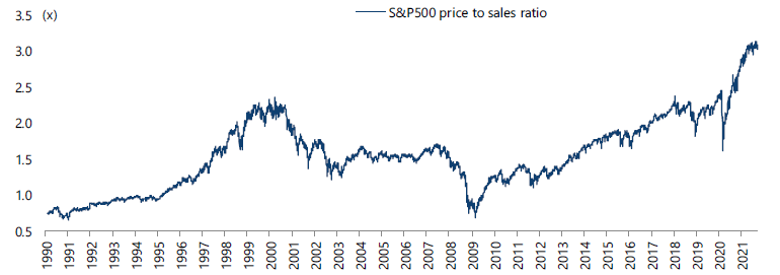
Date care of Bloomberg from January 1, 1990 through September 30, 2021.
While valuation discrepancies can exist over the short to medium term, both the Shiller CAPE and the Price to Sales Ratio tend to Mean Revert over time. Should Equity Market valuations normalize over the next 5 Years, Growth Equities could repeat their relative performance from 2000 – 2012 or from 1973 – 1992. Both represented long periods of underperformance relative to the Equity Markets.
Equity Cycles tend to occur over long periods of time while investors tend to focus on short horizons. The average investor judges markets on their performance over the past few years, assuming the past is prologue to the future. Unfortunately, as market cycles demonstrate, the future rarely resembles the past. And each decade possesses its own characteristics that only become clear in retrospect. With investors having embraced the future, as valuations indicate, the real future will come rushing forward. And given current valuations, this may come as a rude shock to investors. With history ready to repeat itself, it appears La Plus Ca Change, La Plus Ca Meme Chose. (Data from public sources coupled with Green Drake Advisors analysis.)
Confidential – Do not copy or distribute. The information herein is being provided in confidence and may not be reproduced or further disseminated without Green Drake Advisors, LLC’s express written permission. This document is for informational purposes only and does not constitute an offer to sell or solicitation of an offer to buy securities or investment services. The information presented above is presented in summary form and is therefore subject to numerous qualifications and further explanation. More complete information regarding the investment products and services described herein may be found in the firm’s Form ADV or by contacting Green Drake Advisors, LLC directly. The information contained in this document is the most recent available to Green Drake Advisors, LLC. However, all of the information herein is subject to change without notice. ©2020 by Green Drake Advisors, LLC. All Rights Reserved. This document is the property of Green Drake Advisors, LLC and may not be disclosed, distributed, or reproduced without the express written permission of Green Drake Advisors, LLC.