Global Economic Quarterly, Part 3: Scenes From Abroad

Dragon Maturity
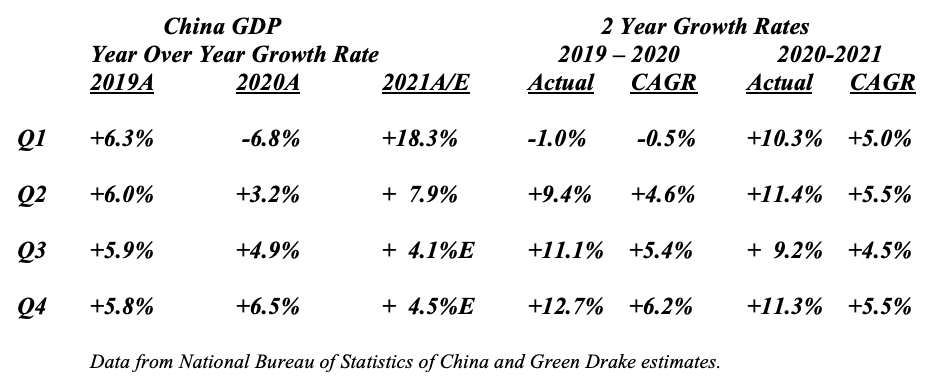
For China, economic growth stands as a mantra: “The economy shall grow 6.5% or better. The economy shall grow 6.5% or better. The economy shall grow 6.5% or better. …” As with any command economy with central growth objectives, China continues down the path of managing its economic growth both to meet various policy objectives and to meet economic growth goals. However, despite the best efforts of those in Beijing, economic reality intruded into the central planners’ goals. First, the Chinese economy only grew 2.3% in 2020 due to the Pandemic, despite the best efforts of those in charge. Second, despite the boost from Pandemic recovery, the Chinese economy continues to slow fundamentally as the law of large numbers impacts the economy. Third, foreign countries no longer will accept Chinese imports targeted to displace domestic industry and began to move to ban these products through both tariffs and import bans. The sum impact of this can be seen in the 2 Year Quarterly Economic Growth Numbers, which normalize for the Pandemic:
In addition to these three country specific factors, there exists a fourth factor that will impact China. Global Goods Production stands 20% above trend due to the Pandemic. As a result, after the global inventory restocking ends in 2022, global consumer demand for goods will normalize as consumers return to spending money on services. Data already supports this outcome as consumer demand for goods as diverse as toilet paper and personal computers, which benefitted from the Pandemic, turned negative on a year-over-year basis.
If China possessed a large Consumer market which could absorb its massive goods production, this would not be an issue. China would move to have Consumers consume the excess domestic production, displacing foreign imports. However, with China already practicing massive import substitution, possessing the #1 share of Global Exports, and having few industries left to displace, this path stands unavailable. Furthermore, with 40% – 45% of its economy manufacturing related, China faces another fundamental problem. A modern economy with up-to-date plant only needs 20% – 25% of its economy focused on manufacturing to provide self-sufficiency. As foreign countries move to limit Chinese imports, the extra 20% of GDP in manufacturing will become a drag on future economic growth. Thus, Chairman Xi moved to push “Common Prosperity”. With this, he seeks to follow the successful path of South Korea in creating income for the average Chinese worker. South Korea focused on acceptable returns, wealth taxes, and income disparity in managing its chaebols to make the transition to slower growth. Such appears the path President Xi chose over the past year to deal with Dragon Maturity. This path also will provide an avenue for Chairman Xi to consolidate his power, enabling the government to sideline and marginalize all those who could challenge his power.
Eclipse of the Sun
Japanese economic growth continues to underperform. Unlike, the US and Europe, Japan’s GDP still remains almost 3.5% below its Q3 2019 peak.
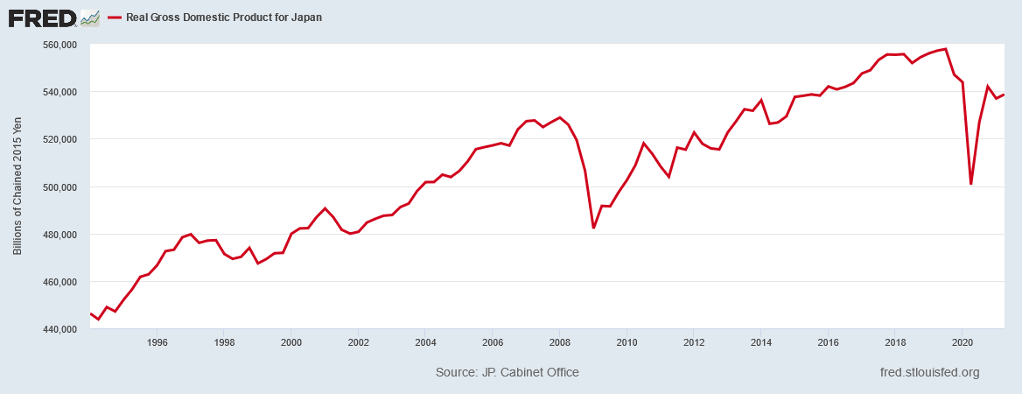
More alarmingly, it stands no higher than it did in H1 2015. Even prior to the Pandemic, Japanese GDP faced serious growth challenges. In the 5 Year span from Q3 2014 to Q3 2019, Japanese GDP compounded at just 1.15%. And for the 10 Year period, Japanese GDP compounded at just 1.27%, using a starting point of Q3 20009, near the bottom of the prior recession. Lastly, if Japanese GDP gets normalized into US Dollars, there exists no growth at all:
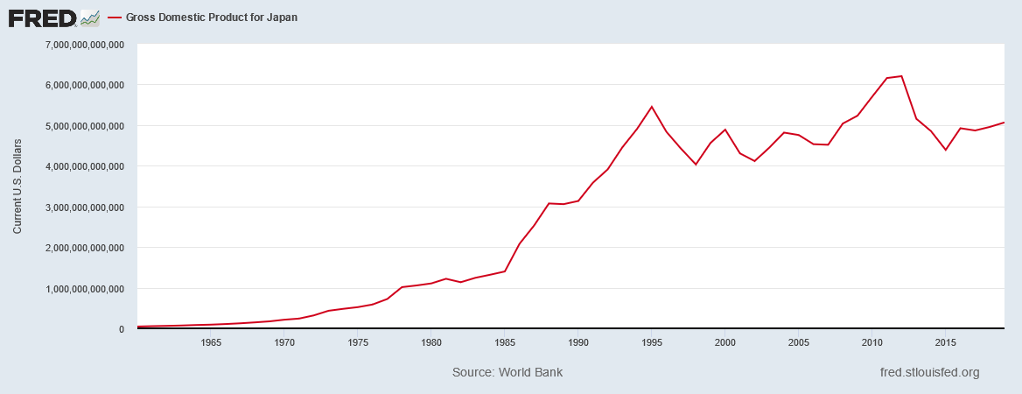
A fundamental issue underlies the poor growth, one that China faces today. Japan built its economy in the 1960s, 1970s, and 1980s on exports. Using an undervalued currency, it drove its global export share upward. However, when the US and other countries reacted and began to limit Japanese import growth, the Japanese economy stalled. And it never recovered from this mortal blow as other countries, such as China, Malaysia, Indonesia, Namibia, …, followed the Japan and South Korea playbooks to grab global market share. For Japan this produced a 20 Year Eclipse of the Sun. Over the past 5 years, Japan began to put in place a fundamental restructuring of the economy. Today, the economy continues to shift towards production supported by domestic consumption and lowered export dependence. While a work in process, continued focus on a fundamental restructuring already shows promise as the domestically oriented sectors continue to outgrow the more export oriented ones. With the passage of time this coming decade, the actions to refocus the economy should finally shine forth, putting an end to the Eclipse of the Sun.
Elephant Trumpets
For India, after a second bout with COVID that laid the economy low, growth came roaring back. Second Quarter growth exceeded 20% Year-Over-Year (YOY) for India, putting the country on track for GDP to reach new heights. The following chart shows Real GDP in US Dollars through the end of 2020:
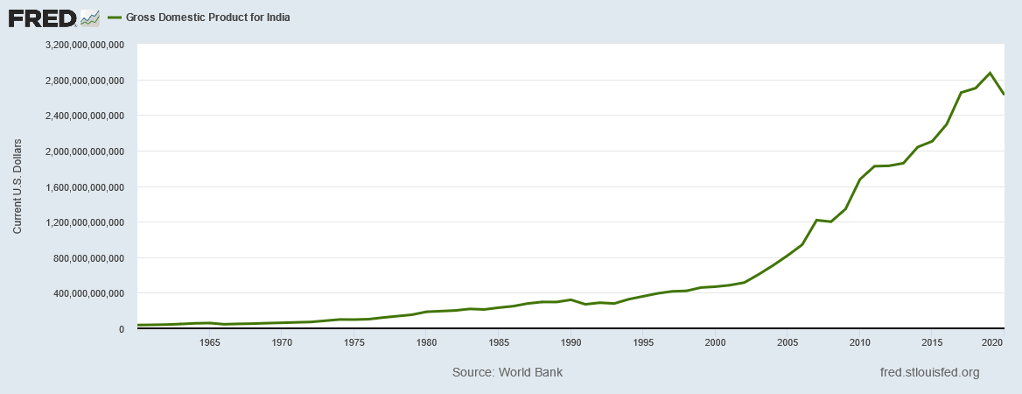
Should India’s GDP continue its snapback, the Year 2021 will end with record GDP for the country. In addition, India continues to invest massively into its economy. Gross Fixed Capital Formation (GFCF) to GDP continues to run in the mid-30s, as the following chart indicates:
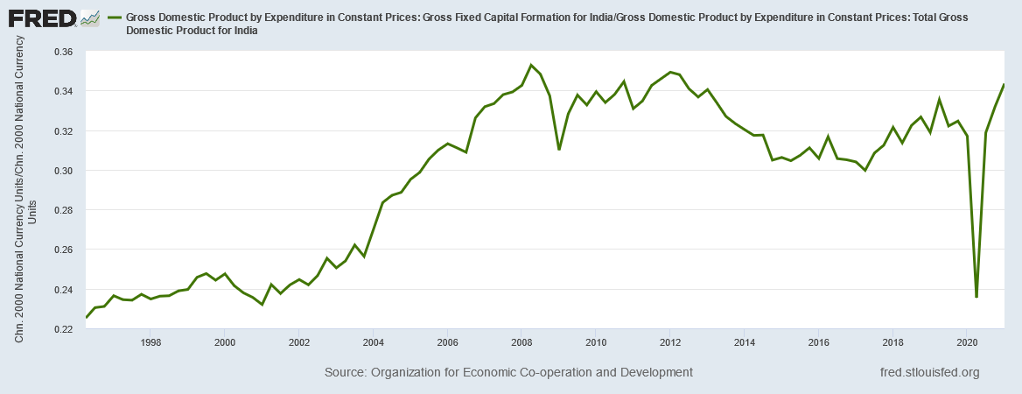
And this level of Investment stands before an additional $1.25 trillion in Investment planned for the next 3 years. In addition to the strong Investment growth, the Royal Bank of India (RBI) continues to provide copious amounts of liquidity. The RBI’s balance sheet expanded 41% over the past year and its holdings in Rupee Securities rose 47%. In total, the RBI Balance Sheet grew from 22% of GDP to 30% of GDP. At the same time, the RBI kept the repo rate at just 4%, the lowest level in years. This liquidity surge coupled with the massive Investment proposed should underpin strong GDP growth over the next few years as Elephant Trumpets sound loud and clear.
Samba Ahead
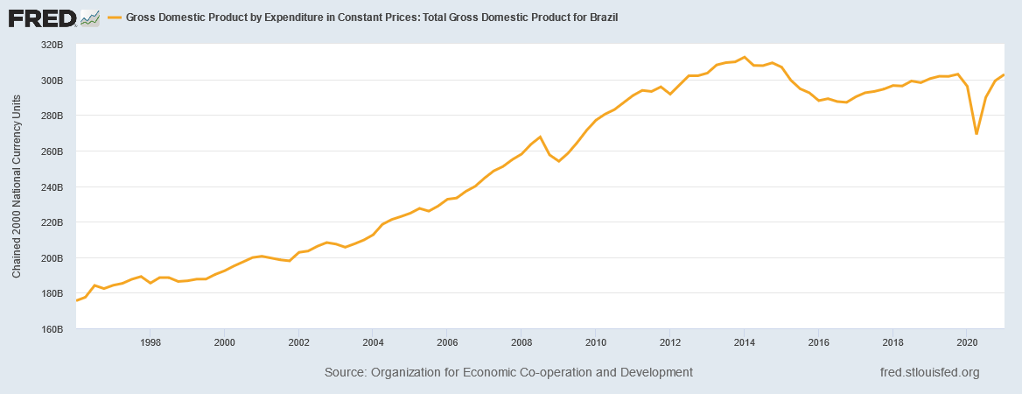
For Brazil, recovery from COVID continues at a rapid rate. The Service Sector exceeded its pre-Pandemic level in June, as the country lifted most restrictions. Foreign Direct Investment accelerated to $6.1 billion or 4% of GDP Annualized. Portfolio Investment registered its 4th positive month in a row with +$3.2 billion. In addition, Brazil received its allocation of SDRs from the IMF. Given all this, when viewed in local currency, it appears Brazil finally will break out of the flat GDP pattern since the end to the commodity bull market:
And in real terms, in local currency, this likely will occur. The short term looks good. But, this misrepresents the core economic issue for Brazil. Reality, in the form of translating the Brazilian Real into US Dollars, reveals a very different picture:
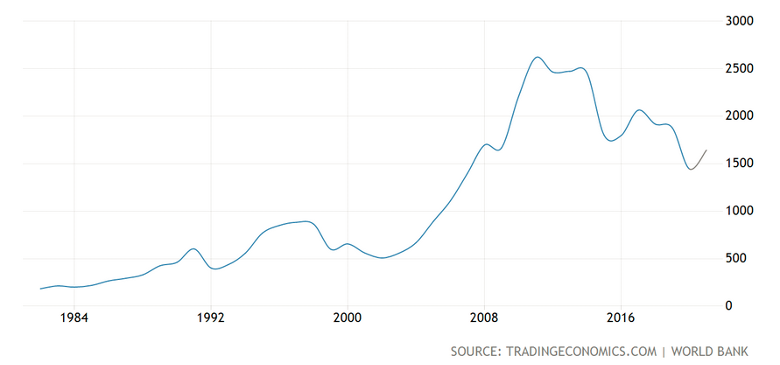
As this chart demonstrates, Brazilian GDP stands over 30% below its level in 2014. In other words, despite its attempts to diversify its economy, it still depends heavily on commodities such as iron ore, soybeans, and energy. And with the collapse in its key commodities prior to the Pandemic, it’s GDP took it on the chin. However, with the recent recovery in commodities and the likely long term commodity upturn that should occur over the next decade, Brazil would find itself well positioned after a difficult decade. And, its GDP in real terms, as measured in US Dollars, could find itself rising to new heights. With this potential in the works, there appears a Samba Ahead.
The Old Man Rises
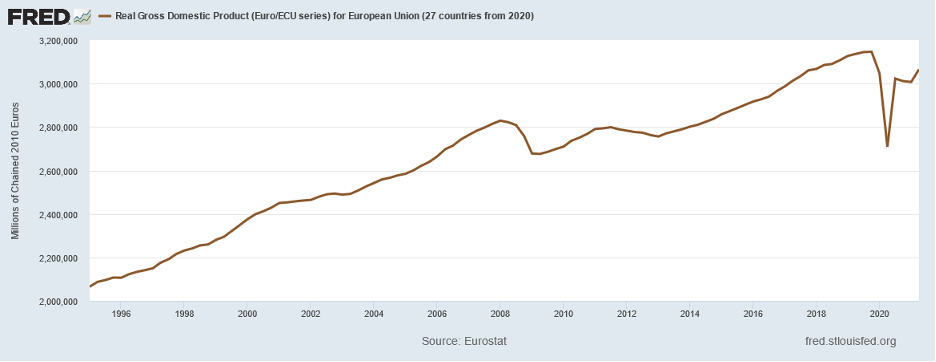
For the EU, GDP continues its strong recovery, now standing just below its prior peak in Q4 2019. As with the US, this recovery stands driven by the traditional early cycle sectors such as Housing, Autos, and Industrials. Despite those worrying about the Delta variant of COVID, recent economic data in the EU continue to support growth that will allow GDP to reach new heights before year end. The following chart illustrates how far the EU travelled over the past year and how little it must travel to attain this goal:
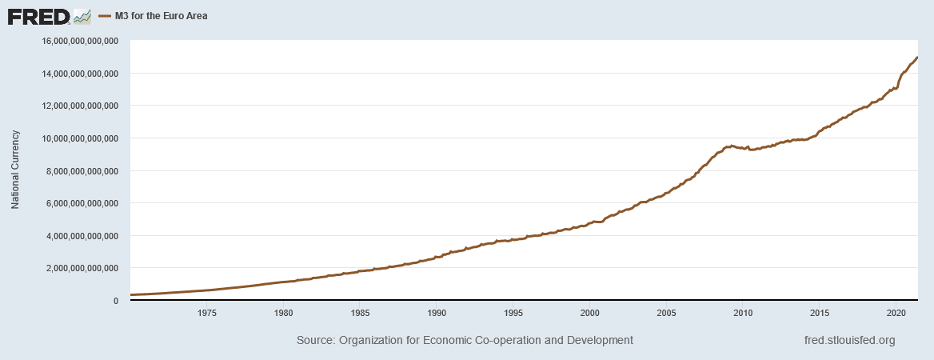
The real fireworks will occur at the European Central Bank (ECB). The following chart demonstrates the massive growth in EU M3, one of the key monetary aggregates, since 2014:
And the following chart shows the significant slowdown in money growth already underway, although hidden by the promises to keep Quantitative Easing in place through 2022:
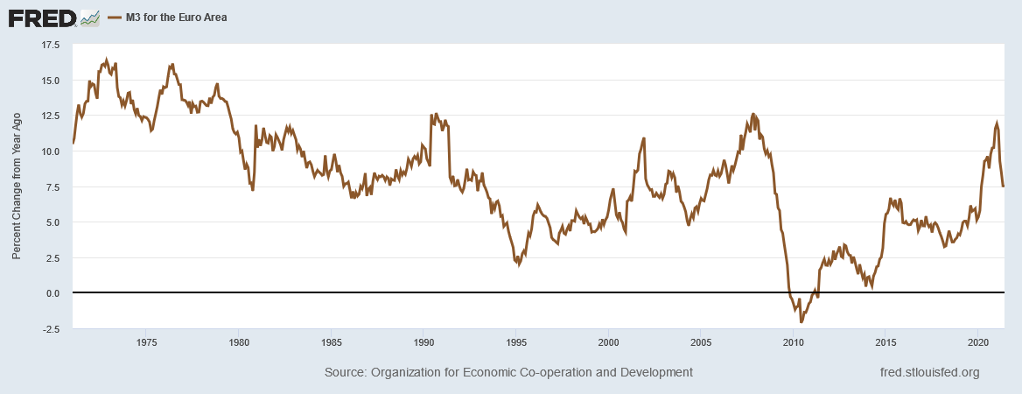
While the ECB may think its job is done, the political environment might weigh into the discussion with a very different conclusion. In order for the EU to remain intact, the economy must grow faster than before the Pandemic. And for this to occur, monetary growth cannot decelerate too quickly, less it create a drag on the overall EU economy. While the Old Man Rises, it remains to be seen whether he holds together.
Continuing The New Climb
For the US, Delta or no Delta, recovery continues at a rapid pace. GDP already exceeded its pre-Pandemic peak and growth estimates for the second half range from 5% to 6%+, despite the Q3 impact from the COVID variant. For 2022, torrid growth should continue at over 5% year-over-year. However, under the surface a major change should occur as the US economy moves from Early Cycle to Mid Cycle and those industries that disproportionately benefitted from the Pandemic see business normalize. With the U.S. recovery unfolding as a classic economic cycle with a few differences, the economy will move from Recovery to Expansion. For areas that enjoyed explosive growth over the past 18 months, such as Housing and Autos, growth should decelerate. For classic Mid Cycle areas, such as Capital Spending and Infrastructure investment, growth should accelerate. And for the classic lagging areas, such as Commercial Construction, which typically bottom 2 years after an economic recovery begins, downturns should end and new upturns begin.
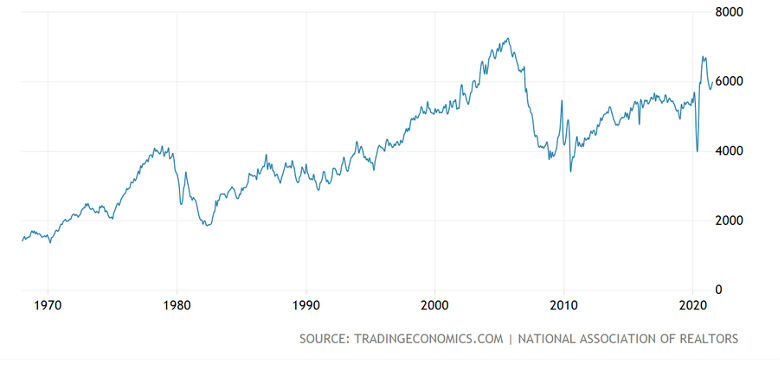
Housing stood the big winner this cycle. Unlike the last economic downturn, consumers possessed strong balance sheets entering the economic shutdowns. With a positive demographic tailwind, as Millennials moved into their prime home buying years, coupled with the flight from cities due to the Pandemic, Housing demand accelerated. In fact, it spiked well above the average turnover of 5.5 million that held from 2014 – 2019 reaching a 6.7 million annual rate in October 2020:
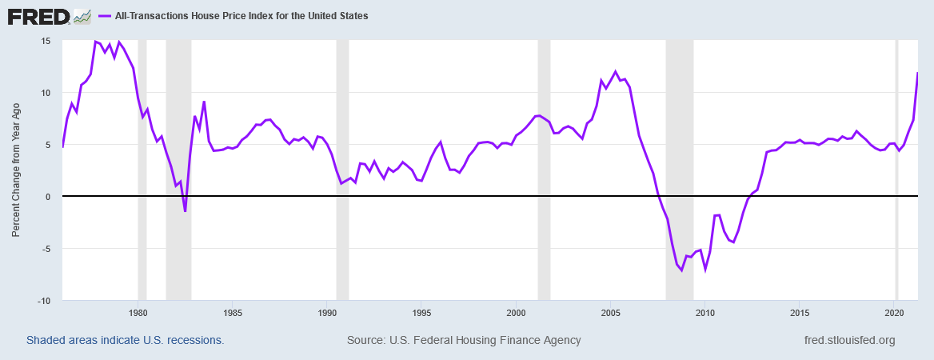
Since then, sales have cooled as prices moved up significantly over the past 9 months. In fact, prices have accelerated in a similar fashion to 2003 – 2006:
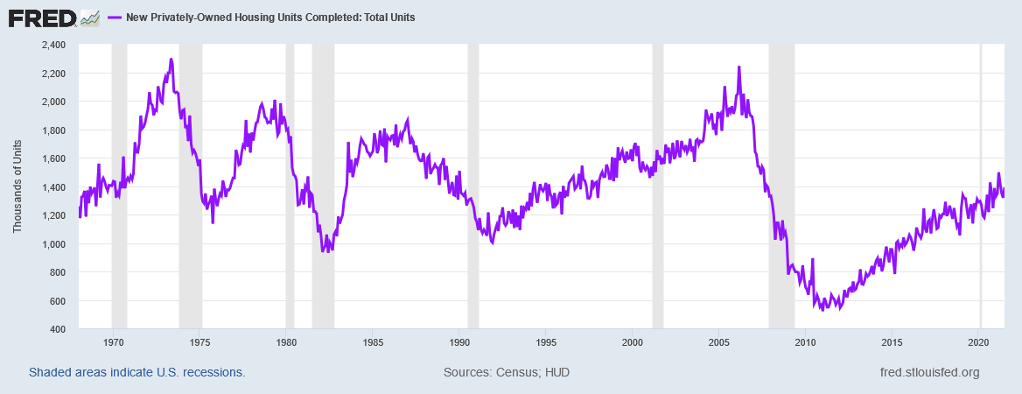
However, the laws of supply and demand have yet to be repealed. The runup in prices encouraged an acceleration in Housing supply. Housing Completions rose to their best level in years:
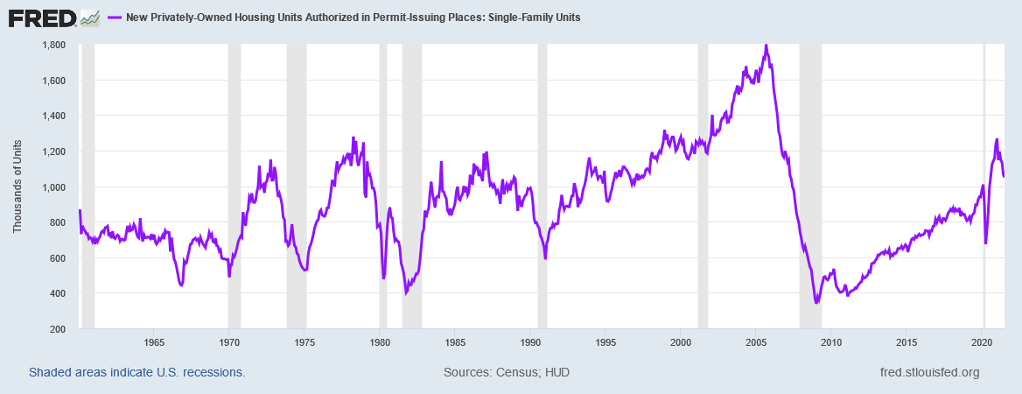
And Housing Permits, representing future Starts and Completions, exploded upward:
With more homes coming to market and prices rising, demand slowed, as the drop in Existing Home Sales illustrates above. This allowed Months Supply of Homes to return to normal:
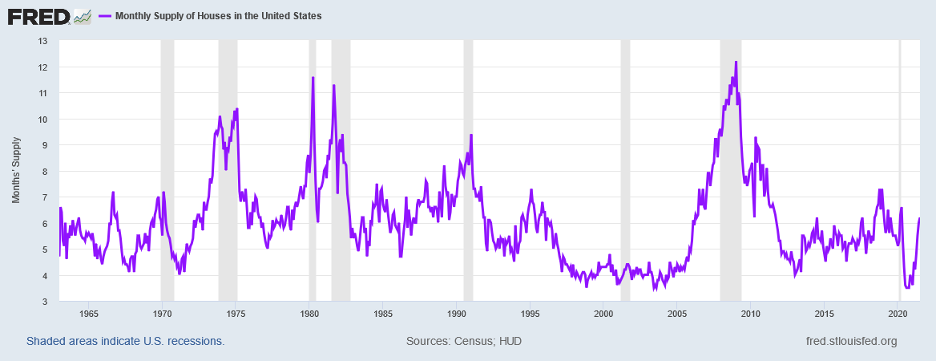
At a minimum, as Existing Home Sales head back to the 5.5 million level and Housing Completions continue to rise, the market should continue to loosen, slowing home price increases or actually flattening them.
This, of course, comes before two other important factors. The first stands the Mortgage Foreclosure Moratorium. At the height of the downturn, over 6.5 million mortgages stood in forbearance under various government initiatives. Today, that number totals 2.2 million. With the end to the Foreclosure Moratorium as of July 31, lenders can once again initiate actions to take control of properties and evict homeowners. Given the normal time lags in the judicial process, foreclosures should start to come to the market in late Q4 2021 or early Q1 2022, amplifying the new Supply to the market, just in time for the Spring Housing Market. Even if just an incremental 300,000 units comes to market next year, it would represent a 5.5% addition to supply. And this excludes any incremental Housing Completions that would occur.
The second factor is Mortgage Rates. Mortgage Rates stand at record lows. The following chart illustrates how far they have come since their peak in 1980:
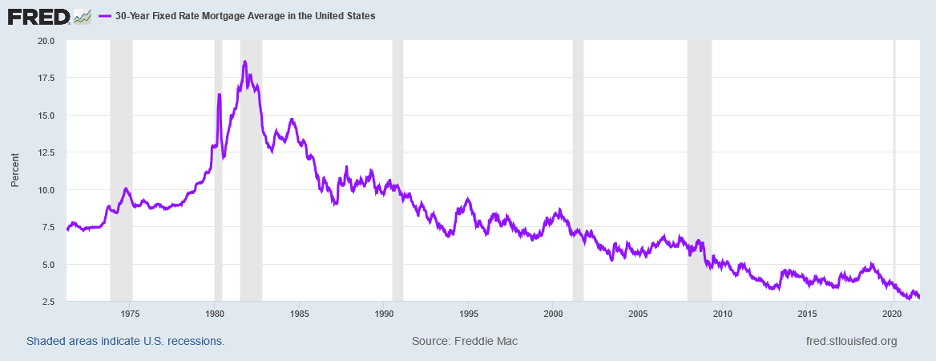
While the one below illustrates their drop over the past 20 years:
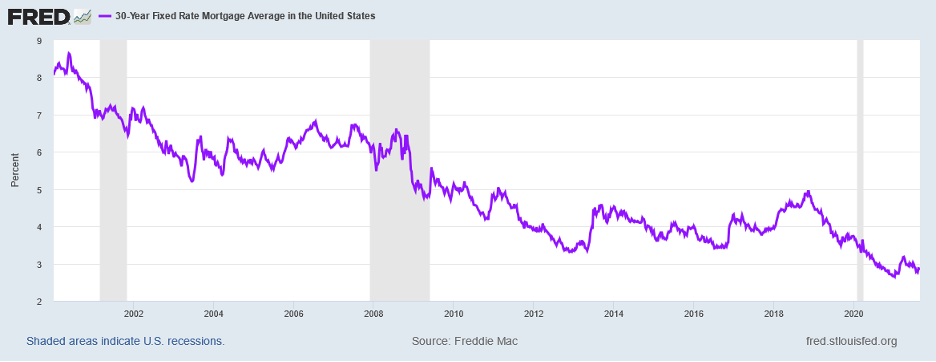
Prior to the Pandemic, 30 Year Mortgage Rates average 4.00%+, in a range of 3.50% to ~5.00%. Today, they stand at less than 3.00%. The curious part of this stands Mortgage Rates in relation to Inflation Expectations. With underlying Inflation running at 5%+ in 2021 and likely to stary relatively strong in 2022, Consumer Inflation Expectations returned to the levels they held before the Pandemic and then rose to levels last seen in 2011 and 2008:
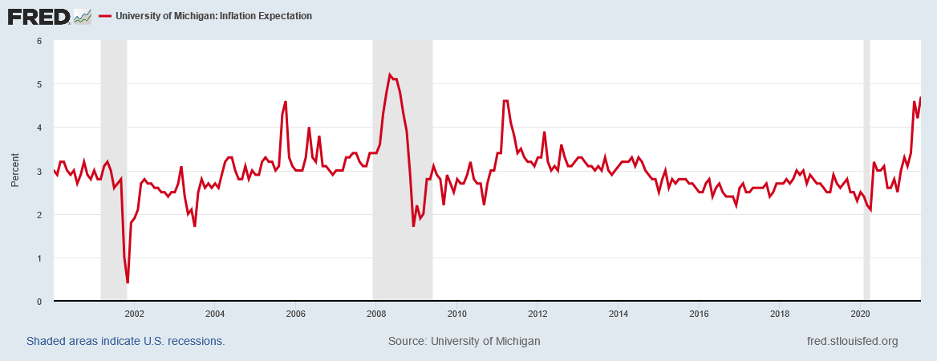
Of course, professional expectations stand lower, but still returned to their 2018 levels and not much below those from 2004 to 2014:

In 2018, Mortgage Rates ranged from 4.00% to 5.00%. In 2011, Mortgage Rates stood between 4.50% and 5.00%. And in 2008, Mortgage Rates averaged 6.00%. Today, Mortgage Rates stand at less than 3.00%. The Federal Reserve announce that it will begin “Tapering” this fall. In other words, it will stop buying mortgage bonds over the next 9 months bit by bit. At a minimum, this will leave more supply for the public markets to absorb, likely leading mortgage rates to drift upward. A 1% drop in mortgage rates enables a buyer to pay 13%+ more for the same home. A 1% rise in mortgage rates creates the opposite effect. If a rise in Mortgage Rates occurs at the same time as Foreclosures come to market and Housing Completions continue to rise, the Housing Market could see a significant slowdown in H2 2022 and 2023. This would represent the classic transition from Early Cycle to Mid Cycle that usually occurs in Year 2 and/or Year 3 of a recovery.
Corporate Capital Spending should offset this slowdown. Corporate Profits continue to rise at a rapid pace. And when Corporations earn more money, they spend more money. Corporate Profits exploded upward as corporations leveraged technology to drive productivity and they benefitted from the typical early cycle surge that occurs:
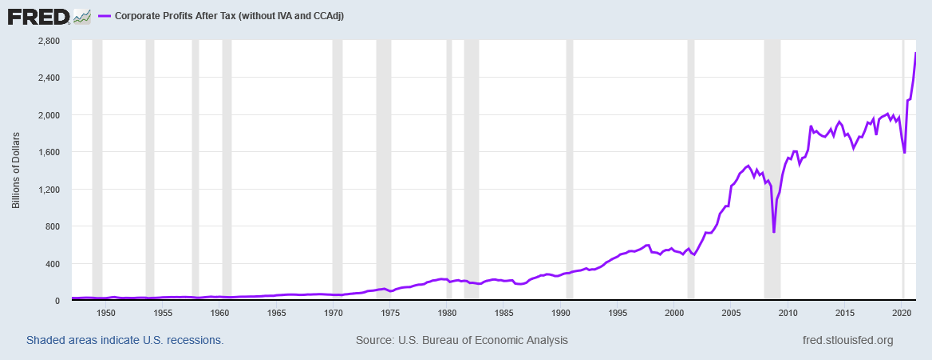
In fact, After-Tax Corporate Profits stand 35% above their 2019 level. This contrasts with Corporate Capital Spending which barely exceeds its pre-Recession level:
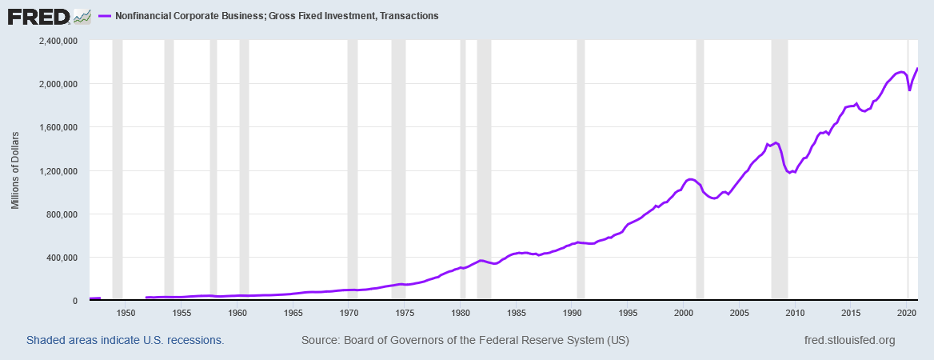
Should Corporate Capital Spending match the percentage rise in Corporate Profits, this would add over $700 billion in spending or over 3% to GDP. This alone should more than offset the slowdown in Housing. And should Infrastructure accelerate, much needed Investment would drive growth.
The US economy stands on the cusp, ready to make the transition from Early Cycle to Mid Cycle growth. Areas that typically lead the economy out of Recession, such as Housing and Autos, stand at or above trend, after strong recoveries. Lagging areas, such as Corporate Capital Spending, continue to pick up steam. Government spending on Infrastructure stands ready to accelerate. And other areas that continue to drag on the economy should bottom, adding to economic growth. With numerous levers set to offset slowing areas, growth should continue at a rapid pace enabling the United States to Continue The New Climb.
Confidential – Do not copy or distribute. The information herein is being provided in confidence and may not be reproduced or further disseminated without Green Drake Advisors, LLC’s express written permission. This document is for informational purposes only and does not constitute an offer to sell or solicitation of an offer to buy securities or investment services. The information presented above is presented in summary form and is therefore subject to numerous qualifications and further explanation. More complete information regarding the investment products and services described herein may be found in the firm’s Form ADV or by contacting Green Drake Advisors, LLC directly. The information contained in this document is the most recent available to Green Drake Advisors, LLC. However, all of the information herein is subject to change without notice. ©2020 by Green Drake Advisors, LLC. All Rights Reserved. This document is the property of Green Drake Advisors, LLC and may not be disclosed, distributed, or reproduced without the express written permission of Green Drake Advisors, LLC.