Global Economic Quarterly Part 2: The Central Banks Go Marching One By One, Hurrah! Hurrah!

“The ants go marching one by one, hurrah, hurrah,
The ants go marching one by one, hurrah, hurrah,
The ants go marching one by one,
The little one stops to suck his thumb,
And they all go marching down,
To the ground, to get out of the rain.
Boom! Boom! Boom!
Children’s Nursery Rhyme
Origins Uncertain
The Global Economy continues its rise from the depths of March 2020. Over the past 17 months, the Global Economy posted some of its best growth statistics in many years as governments moved to fill the gap and Central Banks served up gobs of money. Developed Markets (DM) recovered their GDP losses with many Emerging Markets (EM) not far behind. The following chart of US Real GDP demonstrates that Q2 2021 GDP exceeded its prior peak of Q4 2019:
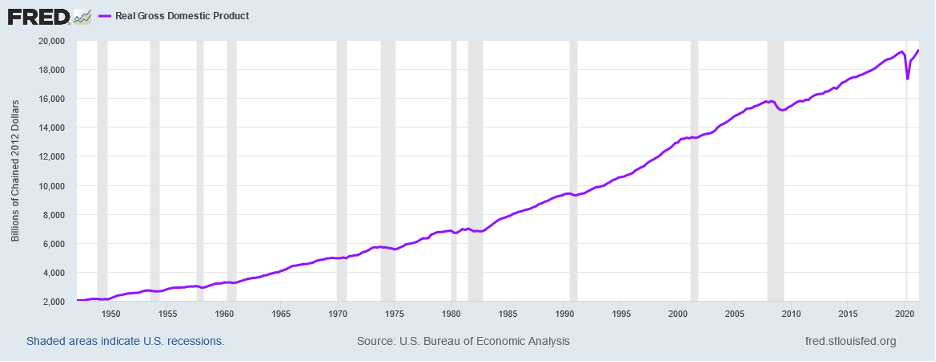
A chart of EU GDP would reveal a similar message. As of the end of Q2, EU GDP stood within 1% of its Q4 2019 peak. And so, one could travel around the world, for the most part, with a similar outcome. This rapid recovery, more reminiscent of economic recoveries prior to 2008, occurred in a classic manner over the traditional 4 – 8 Quarters, taking 6 Quarters to exceed its prior height. And the expected Early Cycle areas led the Global Economy out of its depths: Autos, Housing, and Manufacturing coupled with the need to rebuild Inventories.
While all good and well for the economy, the rapid recovery creates issues for Central Banks. Having provided gobs of liquidity, last seen during the Great Depression, full economic recovery over just 6 Quarters poses a challenge. The first challenge stands Inflation. Unless someone spent the past 12 months living on the planet Pluto, price inflation for goods stares one in the face. While blamed on global supply chain disruption, the real culprit stands demand. Demand for global goods overall exceeds its pre-pandemic level by 20%+. With little to no capacity added over the past year and manufactures rushing to have capacity catch up with demand, capacity utilization reached levels consistent with past episodes of manufacturers raising prices aggressively. Whether for containerboard to move goods or for insulation in new construction, prices for goods accelerated upwards given the supply-demand imbalance. Central Banks have hitherto used words like “transitory” to justify inaction in the face of clear data. However, should inflation prove sticky, there will come a tension between the goals of Central Banks and the goals of governments. Central Banks typically focus on price stability and economic growth, assuming some natural growth rate for the economy. They primarily focus on economic growth while controlling inflation. If inflation exceeds “acceptable” levels, they step on the monetary brakes. Governments, on the other hand, want to deliver strong growth that will underpin their political fortunes. So what, if this produces some inflation as long as growth stays strong. Then there exists the Pandemic hangover. Governments took on significant debt during the Pandemic to fight the Recession and the lockdowns. This drove budget deficits through the roof across the globe and public debt to GDP ratios upward. Governments now desire strong Nominal GDP Growth to bring debt to GDP ratios in line. Anything less will create financial limits down the line. Thus, a little more inflation stands a good thing from this perspective. Given the incompatible policy goals, tension between Central Banks, tapping the brakes, and Governments, focused on growth, will rise as the economic recovery continues.
The second challenge for Central Banks stands Inflated Asset Prices. Early in a recovery, liquidity finds its way into the financial markets. Then, as the real economy responds to Central Bank actions, the real economy demands the liquidity, draining a portion out of the financial markets. The following chart from Robert Shiller with his famous CAPE Ratio makes clear just how much record liquidity from Central Banks led to near record valuations in the Equity Markets:
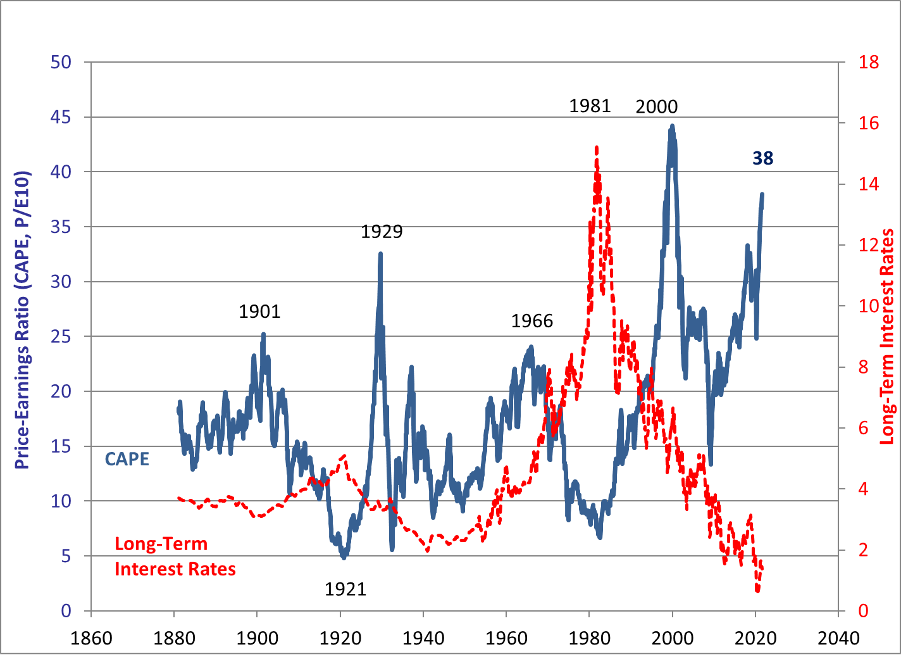
Equity valuations appear on the way to equaling or exceeding their peak in 2000. These types of excesses in Equity Markets possess a long history and even a recent history such as 1999 – 2000, 1987, and 1972 – 1973. (In 1973, the excess was concentrated in the Nifty 50, which saw their valuations collapse in the 1973 – 1974 Bear Market.) In each of these periods equity prices disconnected themselves from reality briefly only to come back to earth in a jarring fashion. Such likely will become the outcome here given the starting point. Other financial markets already have begun a rotational correction as liquidity moves to the real economy. For example, lumber rose 4x from its pre-Pandemic level over the past year then fell rapidly back to where it started:
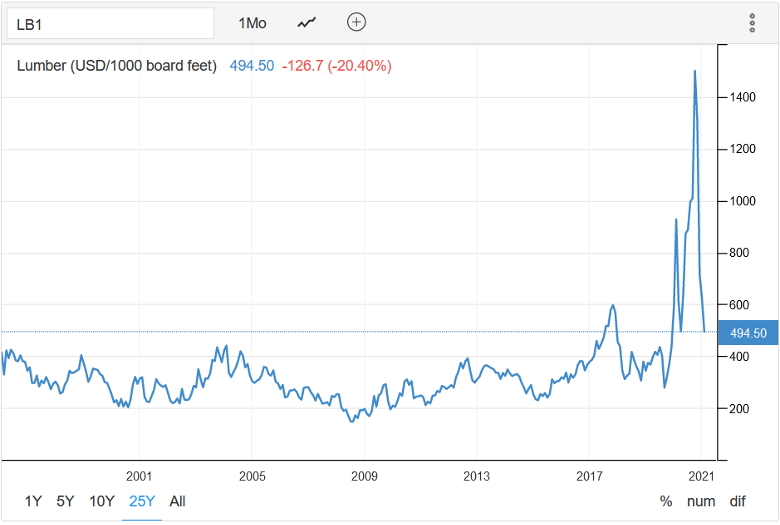
Fortunately, lumber prices do not represent a worry for Central Banks, as they represent the type of commodity speculation seen at various points in markets as diverse as coffee, tin, rubber, corn, oil, and copper over the past 50 years. (One can examine prices over the past 200 years as well with similar results.) Nothing new for commodities. But, given the influence of equity prices on consumers, a normalization here could deliver real economic consequences.
In addition to the financial markets, this excess liquidity found its way into Real Asset markets, such as Housing. The following chart shows just how far Housing prices traveled this recovery as well as the parabolic movement in prices since the recession in Q1 2020:
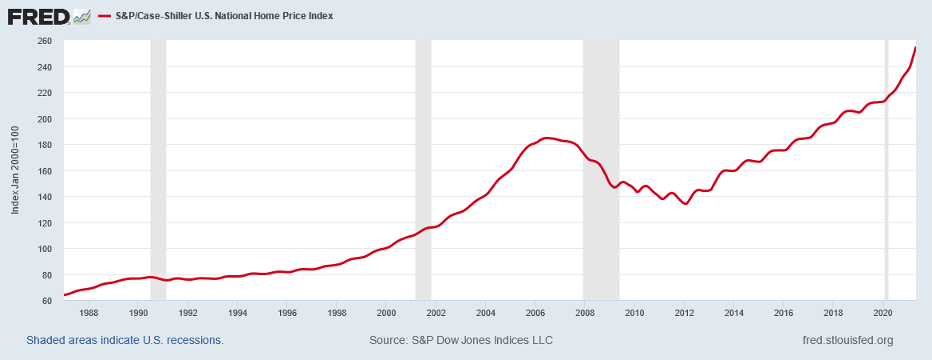
Of course, with investors piling into homes to create portfolios of rental properties, Housing became a speculative asset class. And with real rates at decades long lows, cheap financing allowed investors to pay more and more for the same asset. This runup in Housing Prices creates a real economic issue for Central Banks as they normalize interest rates and financing costs. How to deflate the excess without creating large problems in the credit markets, banking system, and the real economy from spillover effects? And how not to harm legitimate homebuyers while tamping down the speculation of the buy-to-rent investor? There exists no simple answer. But, Central Banks began to act over the past few months. Whether in New Zealand or Norway or Chile or other countries around the world, Central Bank actions to lower liquidity additions and/or raise rates appear underway with numerous other Central Banks ready to follow their lead. This, over the next 12 months, should move financing costs back towards the range they held from 2009 – 2019, which would represent a shock to current asset values. To soften the impact on certain classes of asset owners, such as homeowners, options exist to alter banking regulations to favor owner occupied homes over investor rental homes. This becomes a likely Act II to restore balance to voters over investors and tamp down the animal spirits let loose over the past two years.
This backdrop leads to the bigger question as the tsunami of liquidity subsides and Central Banks return to more traditional monetary policy. How will this reduction in monetary stimulus impact the real economy? For insights into this impact, China may provide a glimpse of the future. The following chart shows Chinese Real Money Growth Year-Over-Year (YOY) adjusted for PPI Inflation:
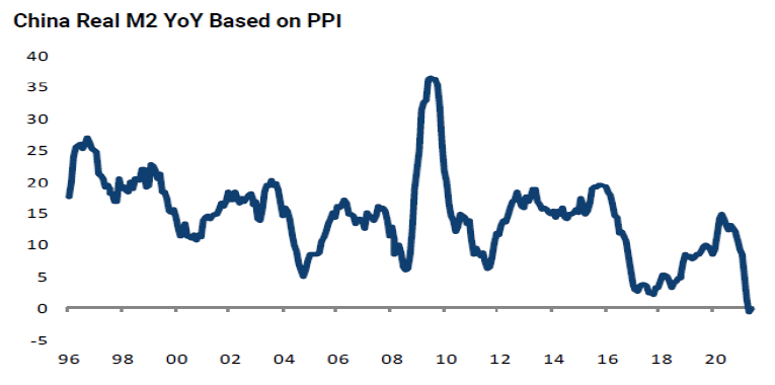
Chinese money growth actually turned negative in real terms due to the massive increase in the PPI. Recently, forecast economic growth for China came under pressure for H2 2021. This stands the expected outcome when a Central Bank tightens policy, even if due to reasons outside its control. Economic growth will decelerate. Projections of H2 Chinese growth dropped from 6.5% SAAR to just 4.3% SAAR. In addition to economic slowing, typically, credit stresses rise when monetary tightening occurs. China’s largest bad debt fund just received a government injection of capital to keep it afloat. If not for this injection, the fund would have collapsed, leading to a run on bad credits in the financial system. As The Central Banks Go Marching One By One down this pathway, the likely outcome stands economy after economy will slow. And, inevitably, as a consequence, Global Growth will come under pressure, even excluding the negative feedback loops from trade. Given these facts and the typical coordinated movement of central bankers across the globe, Global Growth likely slows more than expected in 2022. Hurrah! Hurrah!
Confidential – Do not copy or distribute. The information herein is being provided in confidence and may not be reproduced or further disseminated without Green Drake Advisors, LLC’s express written permission. This document is for informational purposes only and does not constitute an offer to sell or solicitation of an offer to buy securities or investment services. The information presented above is presented in summary form and is therefore subject to numerous qualifications and further explanation. More complete information regarding the investment products and services described herein may be found in the firm’s Form ADV or by contacting Green Drake Advisors, LLC directly. The information contained in this document is the most recent available to Green Drake Advisors, LLC. However, all of the information herein is subject to change without notice. ©2020 by Green Drake Advisors, LLC. All Rights Reserved. This document is the property of Green Drake Advisors, LLC and may not be disclosed, distributed, or reproduced without the express written permission of Green Drake Advisors, LLC.