Equities 2021: Internet Millionaires, The Revenge of Value, & The Return of Emerging Markets

“History never repeats itself. But the Kaleidoscopic combinations of the pictured present often seem to be constructed out of the broken fragments of antique legends.”
The Gilded Age: A Tale of To-Day
by Mark Twain and Dudley Warner, 1874
For those of us who remember Net2000 Communications, Inc. and its spectacular IPO in 2000, the markets today look eerily similar to that era. Companies continue to come public at huge valuations only to see those valuations increase significantly post-IPO. With the crop of IPOs, SPACs, and Direct Listings in 2020 standing at a record level and numerous companies coming public with revenue and little to no earnings, the tale of Net2000’s IPO and its aftermath stands as a warning to all the current Internet Millionaires. Net2000 Communications, which started out as a reseller for Bell Atlantic Corp., one of the “Baby Bell” telephone companies, transitioned to becoming a Competitive Local Exchange Carrier or CLEC in 1998 selling DSL Services to businesses with 50+ lines. With the public market for CLECs hot, the company came public in January 2000. Over the past year, other CLECs that came public saw their stock prices soar. For example, Covad Communications came public on January 21, 1999 at $18.00 per share. By March 7, 2000, Covad’s stock price reached over $100 per share. This occurred despite the company losing $195.4 million in 1999 on just $66.5 million in revenue. Into this environment, Net2000 came public. Its IPO pricing range, set by the underwriters, originally targeted $12.50 to $16.00 per share. Due to massive demand, the company came public at $20.00 per share, only to see its stock soar to over $30 a share post-IPO. At $30+ per share, the company valuation exceeded $1 billion despite only delivering $25 million in revenue in 1999. Once the Internet Bubble burst, Net2000’s share price, along with its business, cratered. On November 16, 2001, the company filed for Chapter 11, Voluntary Bankruptcy. Not only did Net2000 end up in bankruptcy, but numerous brethren CLECs joined it such as Teligent and Turnstone Systems. All in all, billions of dollars of investor capital got wiped out in the following industry and stock market bloodbath. And so did instant Internet Millionaires who found they needed a job 12 to 18 months later.
The Year 2020 drove a record number of IPOs. IPOs totaled 480, according to www.stockadvisor.com, more than 20% above the record level of 397 in 1999. The following chart shows this record issuance compared to the past 20 years:
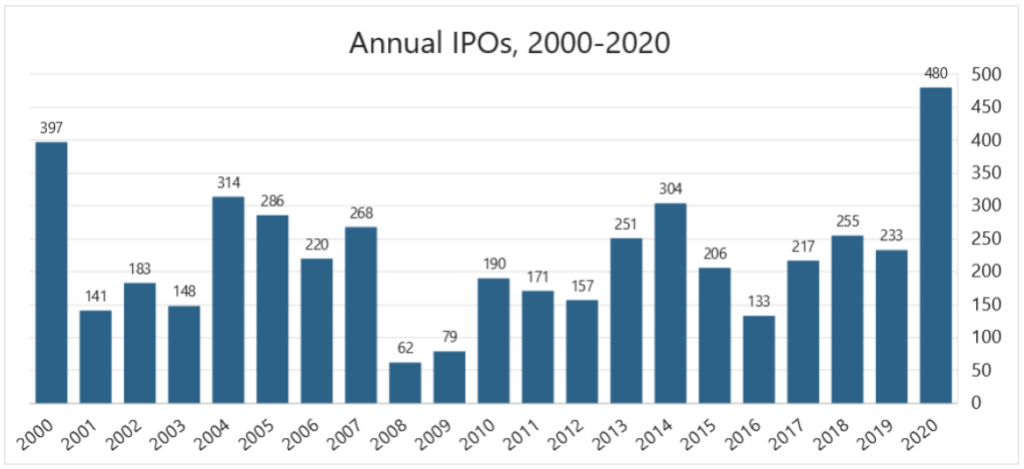
Chart courtesy of stockanalysis.com.
Numerous stocks soared post IPO. Just since their arrival to the public markets in December, the following stocks rocketed upward: 908 Devices (Symbol: MASS) +164%, Scopus Biopharma (Symbol: SCPS) +160%, Upstart Holdings (Symbol: UPST) +163%, Wunong Net Technology (Symbol: WNW) +572%, Hydrofarm (Symbol: HYFM) +222%, and C3.ai (Symbol: AI) +242%. Not only a record year for IPOs, but a record year for IPO performance.
On top of this performance stands the performance of Technology and Growth Stocks. The NASDAQ, which represents a proxy for Technology stocks, rose almost 43% in 2000. And the Russell 1000 Growth outperformed the Russell 1000 Value by 37%, according to data from Credit Suisse. The strong difference between Growth and Value performance occurred not only in the larger capitalization stocks, such as in the Russell 1000 or S&P 500, but across all market capitalizations, including mid cap and small cap securities. The performance difference of 30% to 37%, depending on which portion of the Equity Markets one examines, represents the highest performance differential since 1999. Emblematic of this record differential in Equity performance and of the record breaking IPO market stand statements made by individual investors that tout their investment success and acumen for all to see. For example, one investor posted online a picture of his portfolio showing that the value of his Tesla stock totaled $11,944,889 and stated “Today I am retiring from the corporate world at age 39. Not selling any shares for the foreseeable future.” Such statements sound eerily familiar from the last time technology stocks and valuations soared. With the current crop of Internet Millionaires sounding like that of a previous generation, one wonders if a similar fall to Earth and comeuppance stands ahead, as occurred from 2000 to 2003, where today’s darlings will face the same fate as companies such as Net2000, Teligent, and Turnstone Systems did in 2000 and 2001.
While Growth Stocks massively outperformed Value Stocks in 2020, the year bifurcates into two periods. In the first period, from January 1 until August 31, the Russell 1000 Growth outperformed the Russell 1000 Value by more than 47%. But from September 1 until December 31, large cap Value outperformed Growth by more than 8%. And while Large Cap Equities outperformed Small Caps through August 31, by over 16%, Small Caps won the battle for the Year with the Russell 2000 soaring 18.6% from September 1 onward and leading the S&P 500 by 2.1% at Year End. Emblematic of this shift is Amazon. The stock peaked at $3,531 on September 2 and currently stands at $3,183. Despite the almost 10% drop, the stock still trades at a lofty valuation of 75x 2021 Estimated Earnings. The following chart makes clear the benefit from the Pandemic and the current stall as the economy stands poised to reopen:

Chart courtesy of Yahoo Finance.
However, despite the stall in the prices of such stocks, the valuation of the overall market shows little improvement. In fact, it shows that valuations continue to soar, with the S&P 500 Price to Sales at an all time record level of 2.79x, eclipsing the peak level of the Tech Bubble of 2.39x in early 2000:
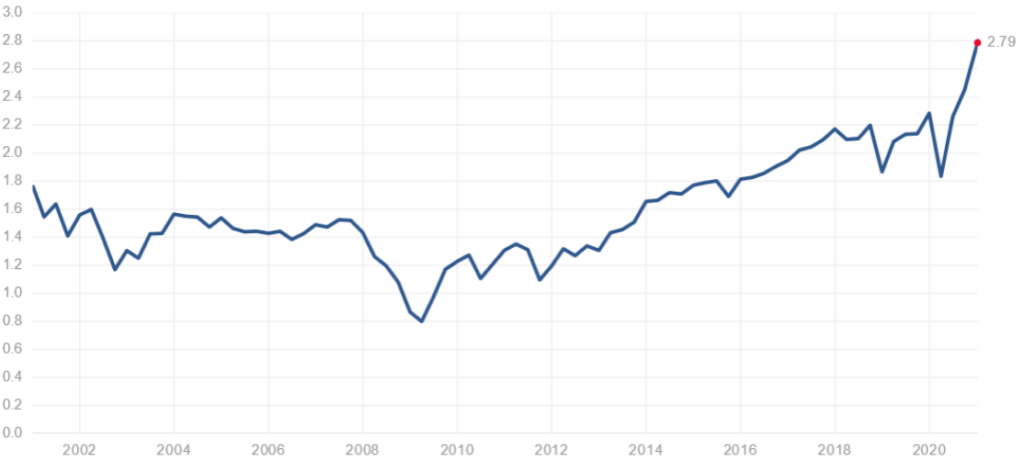
Chart courtesy of www.multpl.com.
The following Chart shows where these valuations stood during the Tech Bubble and how today’s valuation nears a level 17% above the 1999 – 2000 peak:

Chart courtesy of Jefferies, LLC.
As the chart indicates, the path forward from these levels reflected a reversion to the mean as Value Stocks, which languished from 1996 until 2000, awoke from their slumber, outperforming Growth stocks for the next decade. With the setup today mirroring this period and Value Stocks about to enjoy the wind at their back, as the US Economy accelerates towards warp speed, The Revenge of Value Stocks appears underway.
Going hand in hand with Value Stocks, oftentimes, go Emerging Markets. As Value Stocks typically reflect the state of the real US Economy, Emerging Market Stocks reflect the state of the real Global Economy. With China headed for a year of strong growth, the US headed for its strongest growth since the 1990s, and Europe recovering starting in Q2, Global Growth will accelerate to its strongest pace in over a decade. With Emerging Market Economies levered to this, through their manufacturing and commodity production, countries across the globe will enjoy increased demand for their goods, driving their profits ahead. The following chart of the MSCI Emerging Market ETF (Symbol: EEM), indicates EM Equities may already be launching into higher orbit:
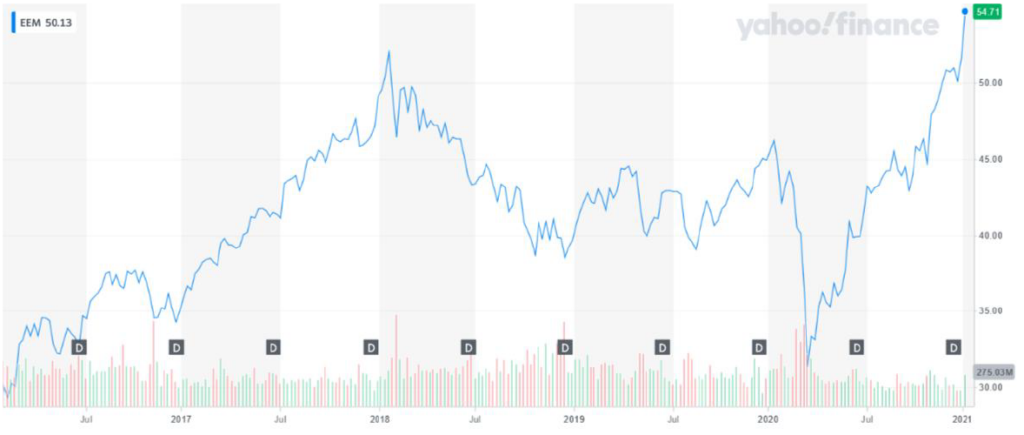
Chart courtesy of Yahoo Finance.
With a favorable economic backdrop in 2021 and more to come in 2022, this move likely represents The Return of Emerging Markets as a core allocation for investors.
While “History never repeats itself” as Mark Twain opined almost 150 years ago, it certainly rhymes. And patterns repeat themselves over and over again, as new generations forget the lessons of the past. With the Equity Markets looking like the 1999 – 2000 Era and Internet Millionaires sprouting like weeds in the garden, warning bells continue to go off. And while investor enthusiasm can drive valuations to incredible heights over the short term, history proves such eras short lived with fortunes made and lost in a short period of time. With Value Stocks beginning to reverse their massive underperformance and Emerging Markets moving higher while Growth Stocks, such as Amazon, move lower, this New Era of the GoGo Growth Stocks may be nearing its end. And when valuations revert to the mean, as in the past, newly minted Internet Millionaires will face the same issues facing the investors in Net2000, Teligent, and Turnstone Systems in 2001. And once the turn comes, as it always has in the past, it will become the time for The Revenge of Value Stocks and The Return of Emerging Markets. (Data from public sources coupled with Green Drake Advisors analysis.)
To go back to our Cover Letter click here
Confidential – Do not copy or distribute. The information herein is being provided in confidence and may not be reproduced or further disseminated without Green Drake Advisors, LLC’s express written permission. This document is for informational purposes only and does not constitute an offer to sell or solicitation of an offer to buy securities or investment services. The information presented above is presented in summary form and is therefore subject to numerous qualifications and further explanation. More complete information regarding the investment products and services described herein may be found in the firm’s Form ADV or by contacting Green Drake Advisors, LLC directly. The information contained in this document is the most recent available to Green Drake Advisors, LLC. However, all of the information herein is subject to change without notice. ©2021 by Green Drake Advisors, LLC. All Rights Reserved. This document is the property of Green Drake Advisors, LLC and may not be disclosed, distributed, or reproduced without the express written permission of Green Drake Advisors, LLC.