This Time Is Different: Consumers, Corporations, and Banks, & The Coming Economic Boom

“But nothing of this is true in the world in which we live. Here every economic force is constantly changing its action, under the influence of other forces which are acting around it. Here changes in the volume of production, in its methods, and in its cost are ever mutually modifying one another; they are always affecting and being affected by the character and the extent of demand. Further all these mutual influences take time to work themselves out, and, as a rule, no two influences move at equal pace. In this world therefore every plain and simple doctrine as to the relations between cost of production, demand, and value is necessarily false: and the greater the appearance of lucidity which is given to it by skillful exposition, the more mischievous it is. A man is likely to be a better economist if he trusts to his common sense, and practical instincts, than if he professes to study the theory of value and is resolved to find it easy.”
Chapter V, Equilibrium of Normal Demand and Supply, Continued
Book V, General Relations of Demand, Supply, and Value
Principles of Economics, 8th Edition
By Sir Alfred Marshall, 1890
Numerous economists and politicians worry about a slow recovery similar to that seen after the 2008 – 2009 Recession. They remember the difficulty the economy had gaining altitude from 2009 – 2012. And they believe a repeat of that experience is at hand. However, there needs to be remembered that these are the same experts who predicted the economy would grow 3.5%+ per annum exiting that recession. And while the economy did endure a deep recession in 2020, in some ways deeper than that in 2008 – 2009, the causes of the 2020 Recession differ markedly from 2008 – 2009, as do the economic conditions prior to the recession. As such, a markedly different outcome appears likely this time with much stronger growth exiting the recession and for the intermediate term.
In 2009, the economy faced a bankrupt banking sector, an overbuilt housing stock, an overextended consumer, and a collapse in state and local revenues which depleted state treasuries. Alas, such a setup typically takes years to correct due to the nature of the problems. As well documented across numerous nations, banking crises that require recapitalizing the banking system tend to lead to 4 – 5 years of subpar growth for an economy as the banking sector addresses the bad assets and rebuilds its balance sheet. Only after that time frame, does growth typically return to normal. In addition, after any sector of the economy sees gross overinvestment, leading to a massive overbuilding of the capital stock in that sector and a collapse in returns and asset values, it takes years to absorb the capital stock put in place such that asset values and returns recover to such a level that new investment is justified. One need only look at commercial real estate after the late 1980s boom, technology after the late 1990s boom, and housing after the 2004 – 2007 boom. In each case, it took the sector years to recover. In addition, consumer debt and debt service stood through the roof, literally. Debt to income and assets hit new highs. The following chart of Mortgage Debt to US GDP illustrates the setup entering the last recession:
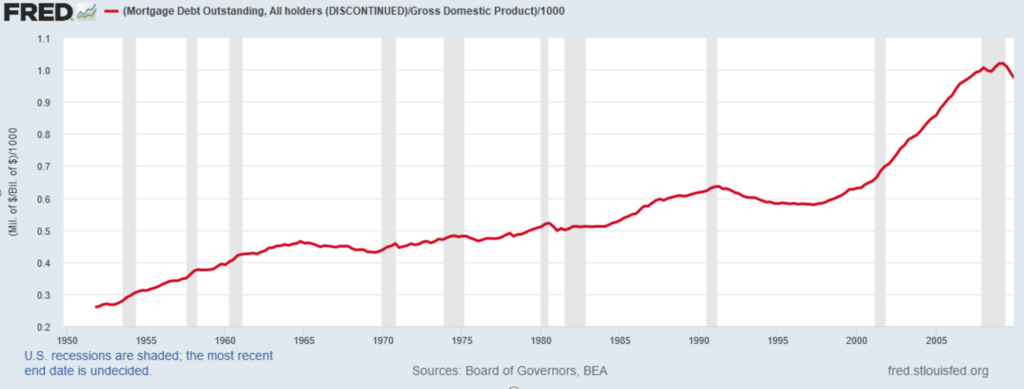
With Mortgage Debt to GDP rising more than 4% from 2001 to 2008, millions of homeowners walked away from their homes, defaulting on their mortgages and declaring bankruptcy. And with home sales collapsing and real estate values sinking to new lows, local tax revenue, which depended on a healthy real estate market, dropped through the floor, literally. And, of course, with home values collapsing, the collateral behind many mortgages no longer stood above the value of the debt. As a result, the banking system collapsed, with only a bailout from Congress preventing an entire destruction of the US financial system. Not a pretty picture.
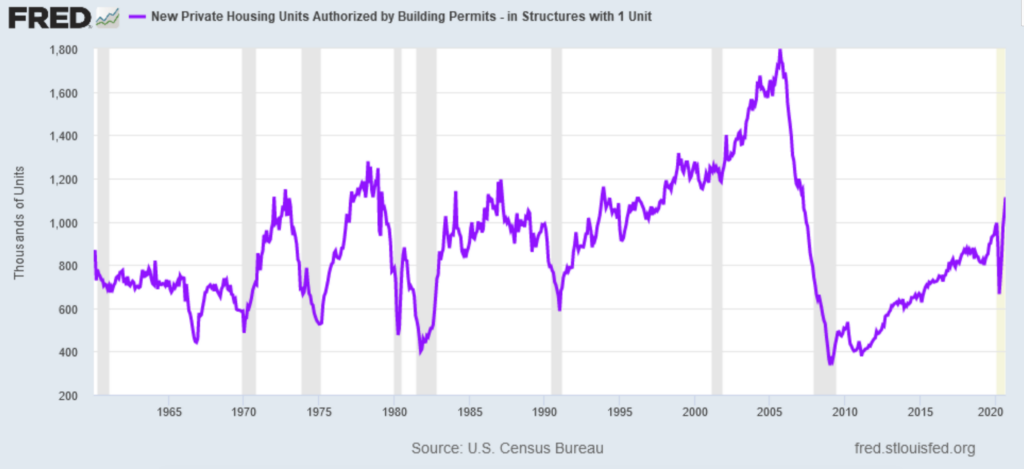
In 2020, by contrast, each one of these economic statistics stands at almost the opposite extreme. The banking system, due to Dodd Frank, possess significant equity capital able to withstand even a downturn of the magnitude of 2009 – 2011 and still provide the lending the economy needs. The Housing Stock remains within normal bounds and new construction stands at levels similar to during the 1990s, avoiding the overbuilding that occurred from 2004 – 2008 and only back to levels seen in the 1980s and 1990s:
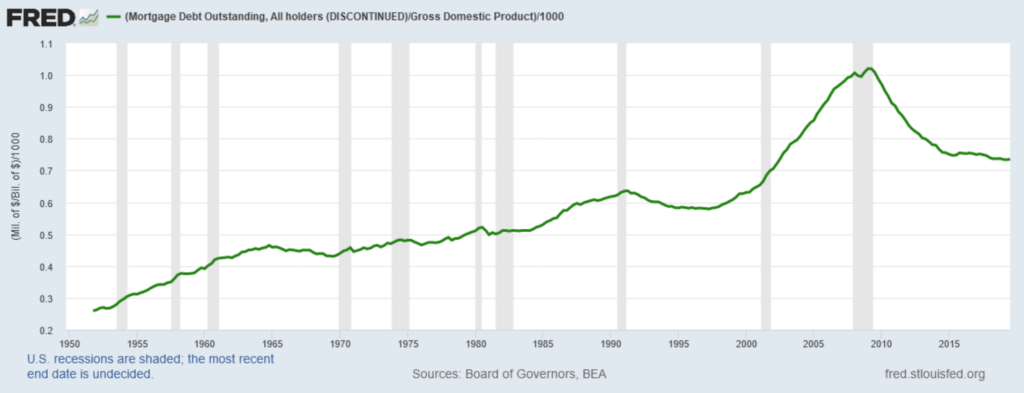
The Consumer remains in good financial shape. Mortgage Debt to GDP, despite the rise in Home Prices, remains at reasonable levels:
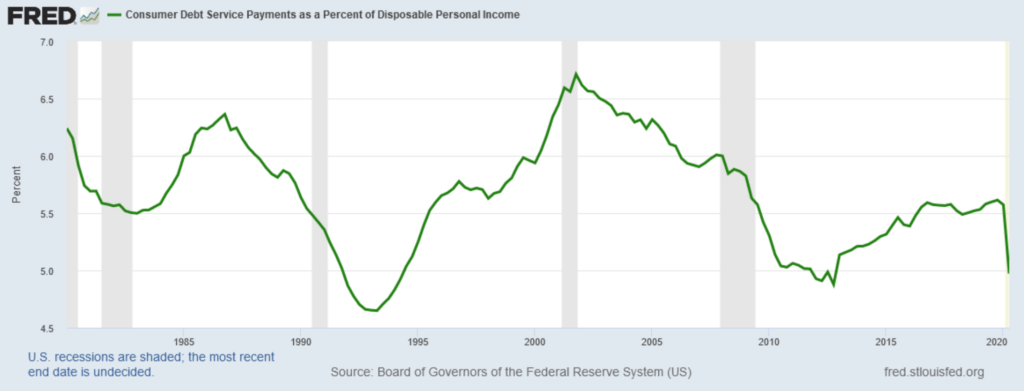
And Consumer Debt Service to Disposable Personal Income now sits at levels that existed right before the 1990s economic boom:
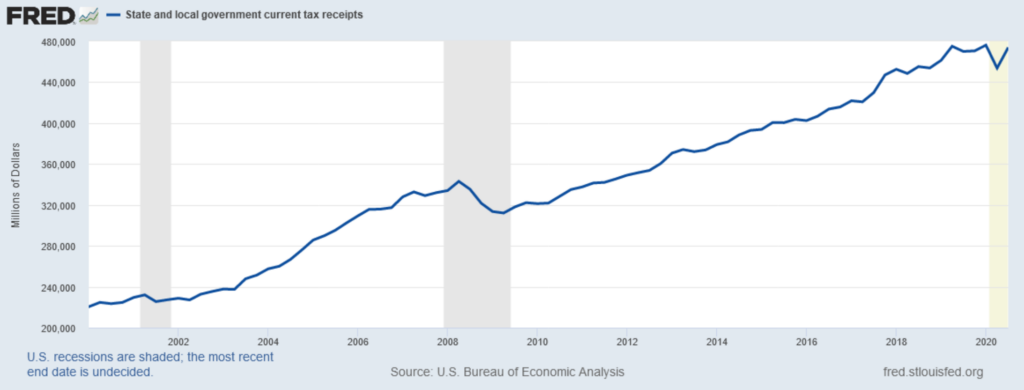
And, while the struggles of particular cities, such as New York City or Chicago, and of individual states, such as New Jersey or California, make the front page of the newspaper and the nightly news, the overall fiscal picture appears strong. State and Local Tax Revenue remains close to its peak prior to the recession. 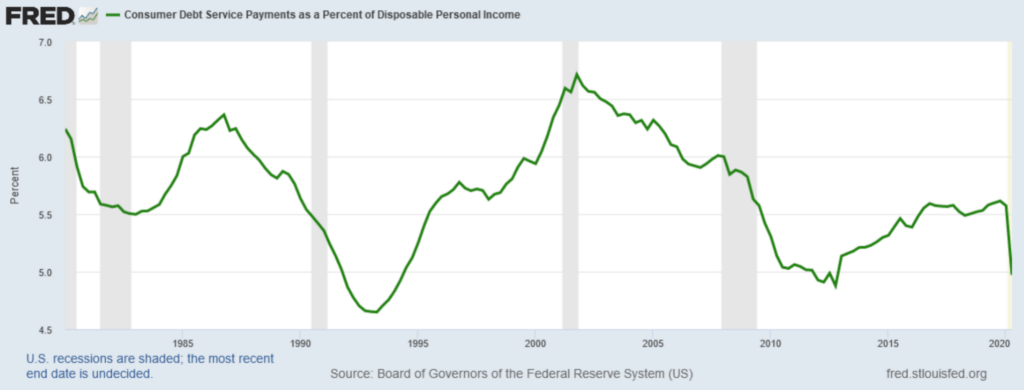
This stands in marked contrast to the prior recession when it took almost 3 ½ years to get back to breakeven on revenue:
With these revenues, in aggregate, above their Q4 2019 levels and less than 1% below their peak in Q1, spending should not experience the massive cuts that occurred after the last recession. In fact, spending stands at record levels:
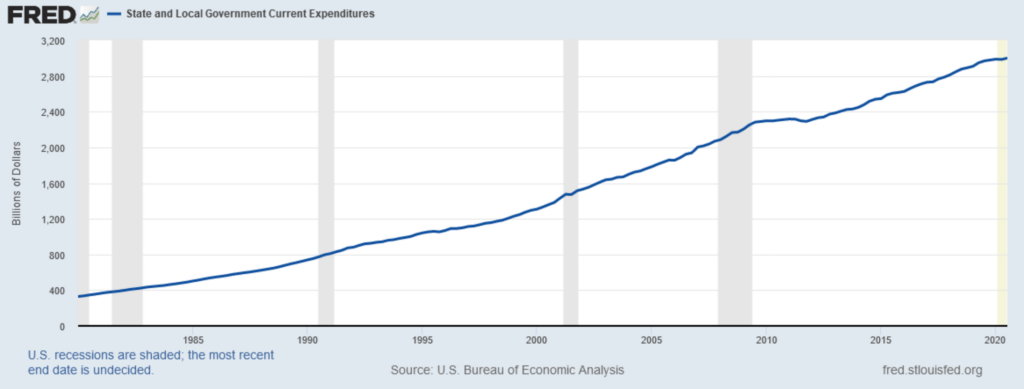
This contrasts with the last recession whereby it took 4 years for State & Local Spending to sustainably recover and exceed peak levels heading into the recovery. And if one examines the Corporate side of the ledger, a bright picture emerges there too. Corporate Profits stand at record levels, as the following chart demonstrates:
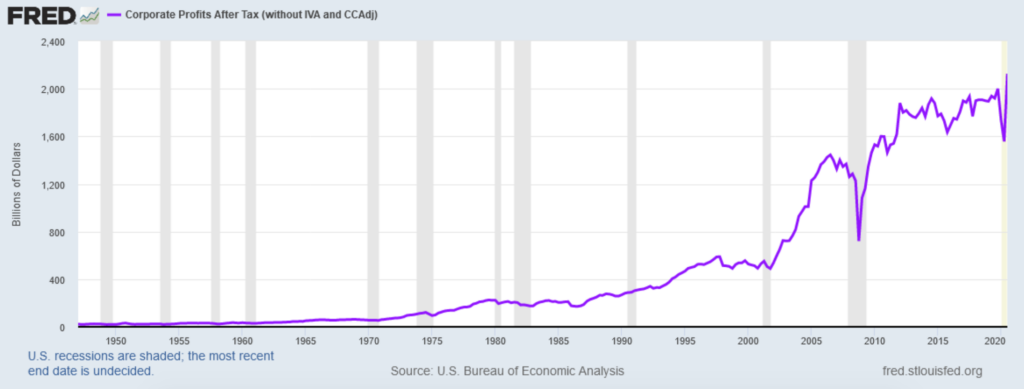
And with Corporate Profits making new heights, hiring and capital spending should follow, as has occurred after every past recession.
Lastly, US GDP appears set to grow strongly in Q4 2020. According to the Atlanta Fed’s GDP Now, the US economy will grow at an 11.2% rate in Q4 or ~2.7% in absolute terms. With Q3 2020 Real GDP at $18,584 billion SAAR (Statistically Adjusted Annual Rate), according to the Bureau of Economic Analysis, this would put Q4 GDP at $19,084 billion or less than 1% below its Q4 2019 peak of $19,254 billion. With the 8%+ of the economy related to travel, tourism, and leisure activities, such as restaurants, hotels, movie theaters, amusement parks, and other places requiring a physical presence, operating at less than 50% of capacity, as the Pandemic wanes, this area of the economy should exhibit strong growth, driving GDP to new heights. And, of course, transportation areas, such as airlines, trains, and buses that enable consumers and business to reach these destinations, will further add to this sharp recovery.
While the Pollyannas continue to look in the rearview mirror, the US continues to move down the highway. Unlike 2009, where a broke banking system coupled with depleted treasuries at the Local and State levels along with a collapse in Housing led to a long road to recovery, recovery already appears strongly underway. Consumers, Corporations, and Banks entered this recession in a solid financial position and, with Federal Government support, exited the recession in solid financial shape. With the Pandemic exiting as 2021 progresses, the shackles on the economy will disappear, allowing the engine to open full throttle, underpinning The Coming Economic Boom. And with the economy racing down the highway with the potential for a massive government infrastructure program ahead, It Is Different This Time. (Data from the Federal Reserve, Census Bureau, and Bureau of Economic Analysis coupled with Green Drake Advisors analysis.)
To go back to our Cover Letter click here
Confidential – Do not copy or distribute. The information herein is being provided in confidence and may not be reproduced or further disseminated without Green Drake Advisors, LLC’s express written permission. This document is for informational purposes only and does not constitute an offer to sell or solicitation of an offer to buy securities or investment services. The information presented above is presented in summary form and is therefore subject to numerous qualifications and further explanation. More complete information regarding the investment products and services described herein may be found in the firm’s Form ADV or by contacting Green Drake Advisors, LLC directly. The information contained in this document is the most recent available to Green Drake Advisors, LLC. However, all of the information herein is subject to change without notice. ©2020 by Green Drake Advisors, LLC. All Rights Reserved. This document is the property of Green Drake Advisors, LLC and may not be disclosed, distributed, or reproduced without the express written permission of Green Drake Advisors, LLC.