Housing: Millennials & Boomers, There’s No Place Like Home, and What If The Economy Recovers?

“Click your heels together three times and say: ‘There’s no place like home’ and you will be there.”
Glinda, Good Witch of the North, to Dorothy
The Wizard of Oz, 1939
Despite a pandemic, a recession, and high unemployment, the Housing Market roared ahead this year. Driven by demographics and mortgage rates at 1950s levels, demand for existing homes stands at levels last seen in 2006 while prices continue to set records. Homebuilder orders exploded, while buyers hunted down scant listings. For those involved in the Housing Market, Boom Times are back.
To understand how things got here and where they likely will go over the next few years, a look at the profile of the Millennials stands in order and how it compares to the Baby Boomers at a similar stage in life. According to the Pew Research Center, Millennials are now the largest adult generation in the electorate with 83.7 million people. Their average age is 31.5 years old. Over 39% possess a college degree compared to just 25% of Baby Boomers. Only 8% have not graduated from high school. The median household income was $71,000+ in 2018. The average age at first marriage is 29 (30 for men and 28 for women). This is 2 years later than Baby Boomers. And with marriage occurring later, so are children, with a similar lag. But with Millennials now in their prime home buying years and children rounding out the home, they are feeling the same tug for suburbia as the Boomers. It is just occurring 2 years later as with marriage and children. In summary, Life Cycle Economics continues to play out. (Please see https://www.pewsocialtrends.org/essay/millennial-life-how-young-adulthood-today-compares-with-prior-generations .)
Given their size in the economy and state of life cycle, it should come as no surprise that the Millennials stand a major factor in the Housing Market. In 2020, Realtor.com projects Millennials to purchase over 50% of homes that transact. How this interplays with the Housing Market can be seen in the following statistics. First, Home Ownership Rates have soared as Millennials flee the urban landscape for suburbia, much as the boomers did before them:
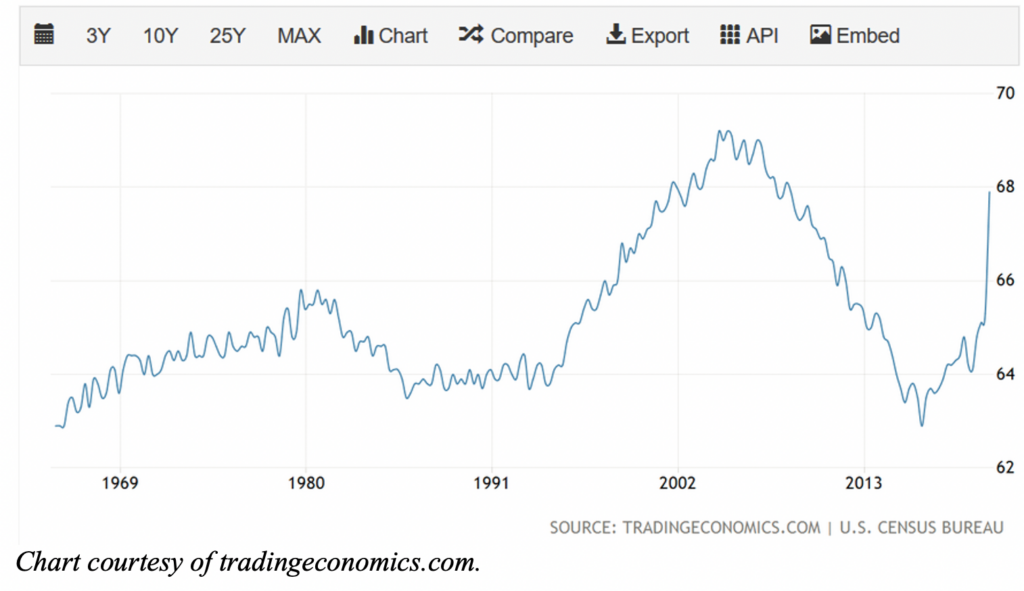
As the above chart makes clear, Home Ownership Rates are approaching the peaks seen in 2006 – 2007. This spike is being driven by the flight from the city due to the pandemic and a big increase in home purchases:
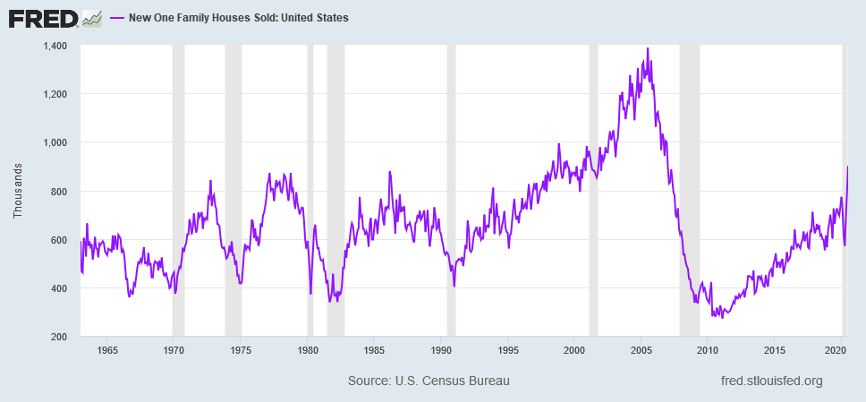
Home purchases in places like Westchester County, a suburban county outside New York City, rose over 40% this year. This spike in demand now equals the peak demand levels seen in the late 1990s, 1986 – 1987, 1977 – 1978, and 1973. This level was only exceeded during the Housing Bubble from 2003 – 2007. Due to the spike in demand, Home Prices continue to soar, reaching record levels that comfortably exceed the peak reached in 2007: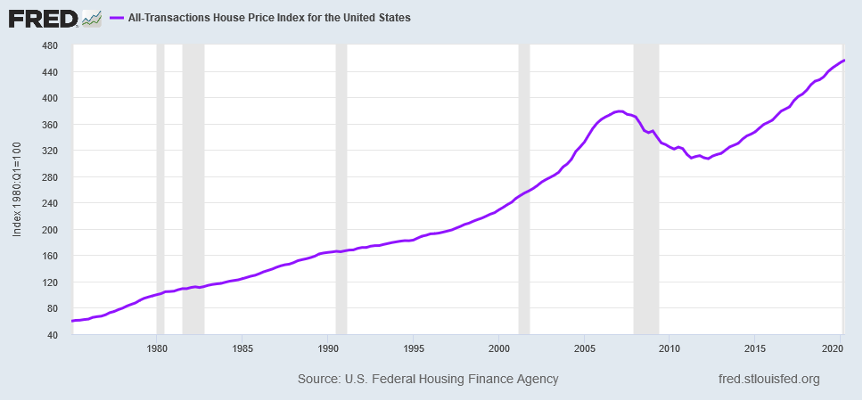
This rise mirrors the rise that occurred from 1993 – 2003, after the last housing bust. Prices continue to rise at a clip that exceeds income growth, increasing 4.4% – 5.4% year-over-year, depending on the price index used:
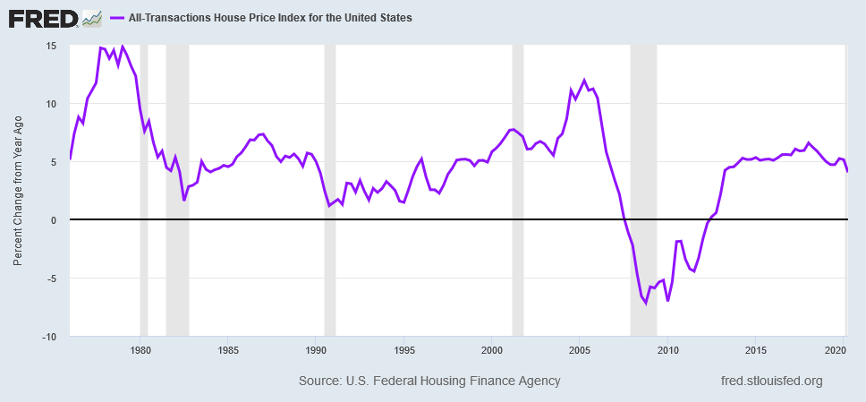
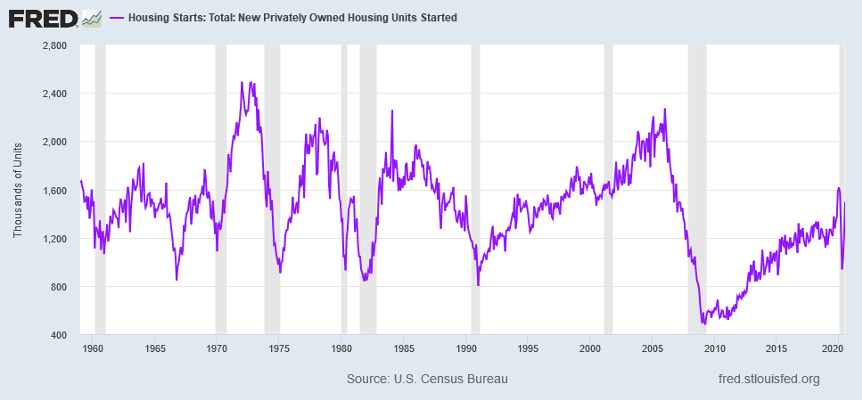
With prices rising at a rapid rate, Homebuilders continue to increase Housing Starts, which finally rose to normalized replacement demand levels of 1.5 million units per year:
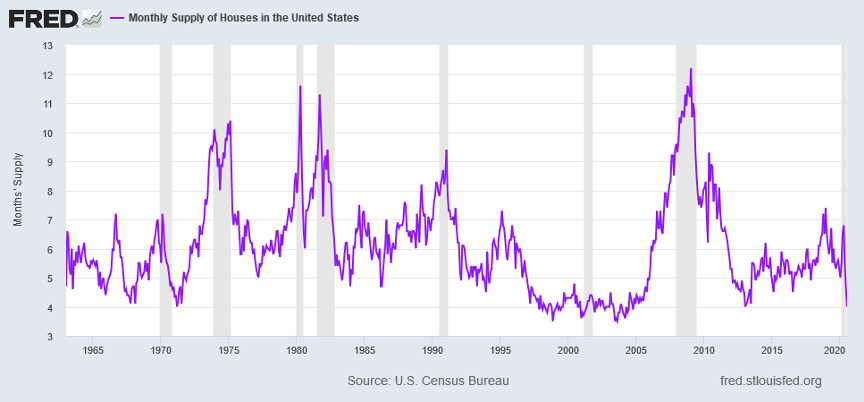
Despite Housing Starts normalizing, months supply of New Single Family Homes collapsed due to the spike in demand:
For the Millennials and those supplying them houses, There’s No Place Like Home.
Of course, the price of Housing depends on three factors. the supply from builders coupled with the demand from buyers, the income and employment of the buyers, and the level of interest rates. As is clear above, builders continue to race to catch up with demand. According to the public homebuilders, demand for their homes rose over 20% year over year. They continue to increase their construction to meet this demand level. Housing Starts nationally continue their rise. And demand for Manufactured Homes, the alternative to stick built houses, continues to recover toward levels last seen in the 1990s. Against this backdrop, however, sits a statistic that belies trouble ahead. Mortgage Delinquencies continue to soar. They reached 6.1% in April and 7.76% in May, according to property research firm Black Knight. (Please see https://www.cfo.com/the-economy/2020/06/u-s-mortgage-delinquency-rate-jumps-to-7-76/ .) As a result, there were 4.3 million homes behind in their payments compared to just 2.0 million in March. And according to the Mortgage Bankers Association, this reached 8.22% in June. (Please see: https://www.mba.org/2020-press-releases/august/mortgage-delinquencies-spike-in-the-second-quarter-of-2020 .) With a foreclosure moratorium in place through August 2020 from Fannie Mae, Freddie Mac, and the FHA due to the pandemic, foreclosures activity should pick up this fall.
As to employment and income, the government’s PPP and EIDL programs provided a life line to businesses that otherwise would have laid off employees in droves. In addition, certain legislation prevented industries, such as the airlines, from laying off workers. With those programs coming to an end and businesses having used up the cash provided by the government, layoffs will begin in earnest shortly. Unlike the restaurant workers and hotel employees with low income levels that typically rent, this will effect those with significant home ownership. Thus, the normal recession adjustments, that were delayed by the government programs, will appear with all their unpleasant consequences, as businesses right size their costs to their revenues. And while these businesses will eventually need these workers, that may not occur until late 2021 or sometime in 2022.
Lastly, mortgage rates collapsed as the Federal Reserve entered into a massive QE program, exploding money and buying securities well down from the normal of high grade treasury bills and bonds. The impact is clear:
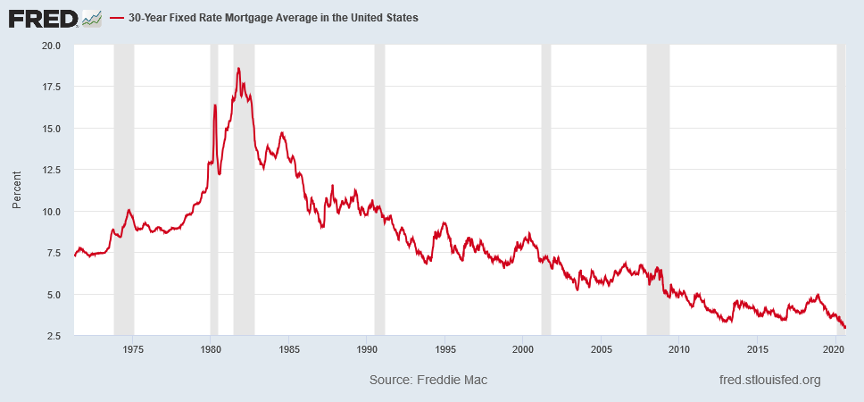
The Federal Reserve’s actions drove mortgage rates from their 3.4% – 4.6% range since the last recession to just 2.90% today. In other words, the Federal Reserve drove the mortgage payment per $100,000.00 in debt from $477.42, at 4.0%, the midpoint of the range over the past 10 years, to $416.23. In percentage terms, mortgage payments are just 87% of where they stood in May, 2019 for the same amount of debt. Of course, if you are a homebuyer with a relatively fixed amount of income, the drop in mortgage rates over the past year allowed you to buy a house priced 15% above what you could afford a year ago. And with Millennials making up over 50% of homebuyers, all of a sudden, they could afford a house they could not before. Thus, the rush to exit cities and buy homes.
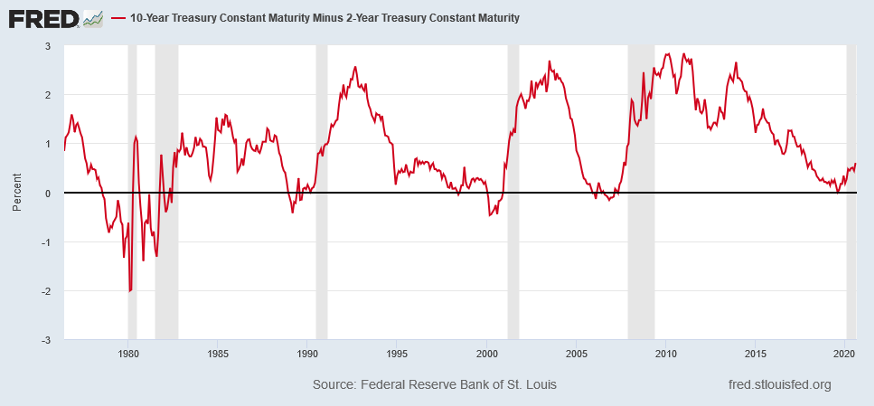
Of course, pandemics end and economies recover. And what typically occurs in recoveries will happen. Rates will rise and spreads will increase. There already exist harbingers of this trend in the interest rate world as US Economic Activity continues to normalize. The 10 Year – 2 Year Treasury Spread, which briefly went below zero in September, 2019, now stands at 0.51%, a level last seen in April, 2018. And should the economy recover, there exists no reason this spread could not exceed 1% or even approach and exceed 2%, as the long term chart below demonstrates:
Thus, Mortgage Rates, if they maintain their current relationship to U.S. Treasury Rates could easily reach 4.0% or more in the next 12 – 18 months.
With a feeding frenzy occurring in the home buyer market today, much like a school of piranhas consuming an unfortunate meal, little appears that could go wrong for the Housing Market. However, storm clouds have begun to appear on the horizon. These include rising delinquencies, looming foreclosures, future increases in homeowner unemployment, increasing Housing Starts, and rising Mortgage Rates. And while Millennials continue to buy homes today, a rise in rates would ration out a portion of today’s buyers and force those left to buy less house. All these factors appear set to play out over the next year. And with economic activity continuing to head towards normalized levels, the question for the Housing Market becomes: What If The Economy Recovers? (Data from Pew Foundation, tradingeconomics.com, Federal Reserve Economic Database, FHFA, and public data combined with Green Drake Advisors analysis.)
Confidential – Do not copy or distribute. The information herein is being provided in confidence and may not be reproduced or further disseminated without Green Drake Advisors, LLC’s express written permission. This document is for informational purposes only and does not constitute an offer to sell or solicitation of an offer to buy securities or investment services. The information presented above is presented in summary form and is therefore subject to numerous qualifications and further explanation. More complete information regarding the investment products and services described herein may be found in the firm’s Form ADV or by contacting Green Drake Advisors, LLC directly. The information contained in this document is the most recent available to Green Drake Advisors, LLC. However, all of the information herein is subject to change without notice. ©2020 by Green Drake Advisors, LLC. All Rights Reserved. This document is the property of Green Drake Advisors, LLC and may not be disclosed, distributed, or reproduced without the express written permission of Green Drake Advisors, LLC.