The Equity Markets: The Roller Coaster To Nowhere & To Dream The Impossible Dream

“Sell in May and Go Away.”
Old Wall Street Saying
“To dream the impossible dream
To fight the unbeatable foe
To bear with unbearable sorrow
To run where the brave dare not go
To right the unrightable wrong
To love pure and chaste from afar
To try when your arms are too weary
To reach the unreachable star”
The Impossible Dream
Man of La Mancha
Lyrics by Joe Darion, 1966
For investors in the equity markets, what a wild ride over the past two and a half years. It reminds me of my trips to Space Mountain at Disneyworld in my youth. First, the rollercoaster is inside a building, so, it is pitch black during the ride. In other words, you can’t see which way you are headed. Then, after the ride climbs you slowly and steadily to the top of the building, it heads downward at breakneck speed, twisting and turning in unpredictable ways, as it makes its way back to terra firma. For today’s investors, it appears the Equity Markets have adopted a page out of Space Mountain. After moving up steadily from February 2016 to a high of almost 2,900 in January, 2018 on the S&P 500, the index plunged in February, only to recover and plunge once more, hitting a low of 2,588 in March. It then rose steadily to a marginal new high of 2,930 in August, only to plunge to 2,351 on December 24, providing investors a wonderful Christmas present. Then with a Fed backstop, it rose steadily through 2019, not stopping until Feb19, 2020, peaking at a high of 3,386, only to plunge to a low of 2,237 on March 23, just one month later. The index then rose steadily to a peak of 3,232 on June 8, only to pull back to 3,100 by June 30. All in all, from January 26, 2018 until June 30, 2020, the S&P 500 provided a total price return of 7.90% or a Compound Annual Growth Rate of just 3.20%. If we add in dividends of 1.9% over the time period, Total Return on the S&P 500 averaged ~5.1%, a far cry from the long term return of 9%. With lots of volatility and not much price progress, investors appear to be riding the Roller Coater to Nowhere.
Much of that Roller Coaster to Nowhere stems from the valuation of the markets. The internal dynamics and valuations look much like those of 1999 and 2000, as the following chart shows:
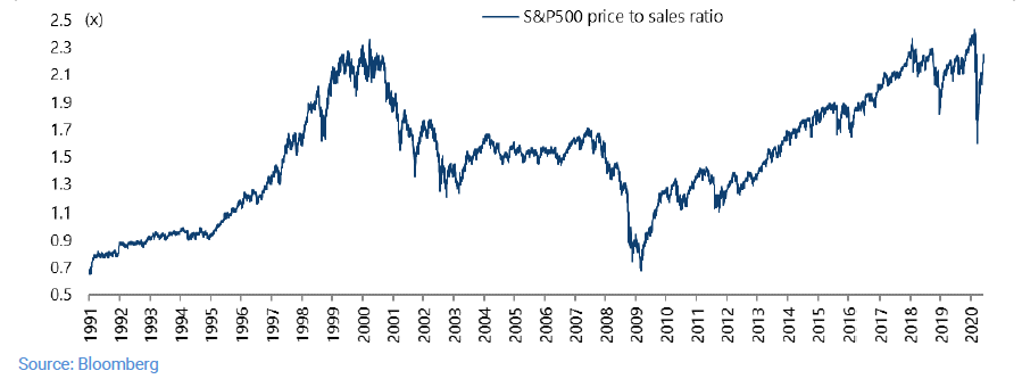
Chart courtesy of Bloomberg.
While stocks went to fabulous valuations during those years, this was followed by a painful period in which valuations corrected and the darlings of that era, such as Microsoft, took almost 13 years to return to and exceed their prior highs. Some darlings, such as Cisco, have yet to do so. (Please see Equity Markets: 1999 – 2000 Again or The New Nifty 50published February 15, 2020; The Equity Markets: A Visit to the 1990s and A 1960s Springtime At The Bourses, published on January 31, 2019; and Shades of 1999: Initial Public Offerings or Indications of the Public’s Optimismpublished April 30, 2019.) And the experience exiting that era mimicked the experience of investors who went through the period of the late 1960s to early 1970s, when the Nifty 50 dominated performance. Companies such as Procter & Gamble were the darlings back then. It took P&G, after the peak in late 1972 and the infamous 1973 – 1974 bear market, until late 1985 to consistently exceed the peak stock price of that era. This equates to a similar 13 year period.
The fundamental issue now, as periodically is the case, comes from the valuation of stocks. Investors get enthused with Dreams and these Dreams can grow to the sky. Robert Shiller’s CAPE (Cyclically Adjusted Price Earnings Ratio) provides an unambiguous signal that we are in one of these eras, such as in 1999 – 2000 with the Tech Bubble, and this indicator continues to flash bright red warning signs:
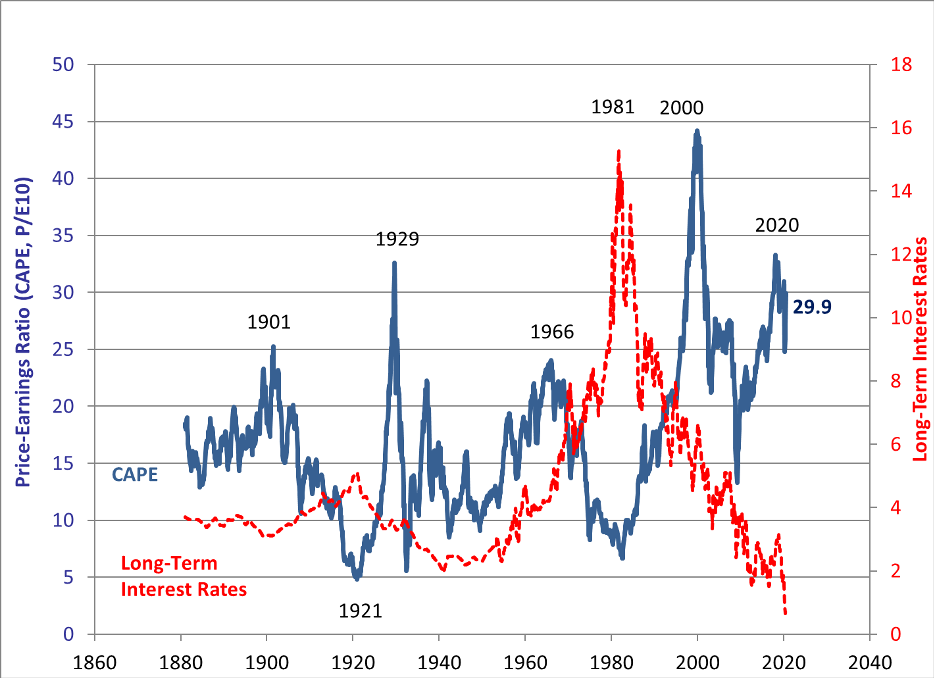
Chart courtesy of Robert Shiller. Please see http://www.econ.yale.edu/~shiller/data.htm .
Valuations today clearly stand at levels that produce mediocre nominal returns over time and potentially poor or negative real returns. And investors memories are short, so they tend to extrapolate their experience of the recent past.
Amazon stands the leading darling of this era. Despite missing earnings estimates for the past several years and having 3 years of essentially flat earnings, investors continue to treat Amazon as if it can do no wrong. Its stock continues to hit new highs as the following chart demonstrates:
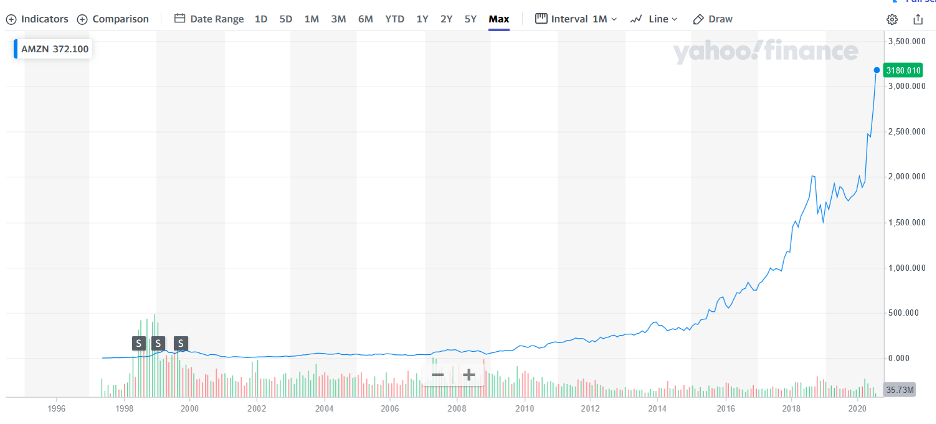
Chart courtesy of Yahoo Finance. Please see https://finance.yahoo.com/ .
Based on estimated earnings for this year from a number of Wall Street firms, Amazon’s projected Adjusted Earnings per share will reach ~$36.50, slightly below last year’s reported Adjusted Earnings of ~$37.00. This is despite revenue growing over 25% this year or by more than $65 billion. We note this concept of “Adjusted Earnings” excludes some expenses that both the accounting profession and SEC seem to think matter in presenting their official GAAP Earnings, such as when they file their earnings statements with the SEC or issue their Annual Report. (GAAP stands for Generally Accepted Accounting Principles.) Now, Amazon’s GAAP Earnings estimates for 2020 stand at ~$19.00 per share, which is almost 50% below the numbers the company prefers to present. And according to Wall Street, their earnings in 2021 will magically jump to ~$54.00 in Adjusted Earnings and $34.00 in GAAP Earnings. Whether next year’s projections sit in the ball park or floating in space, the stock currently trades at $3,185 per share. Using Adjusted Earnings for 2020, the P/E (Price to Earnings Ratio) for the stock merely stands at 86.1x earnings. Using GAAP Earnings, this number reaches 167.6x, a truly remarkable number given that Amazon will generate almost $350 billion in revenue this year. And, with a market capitalization of ~$1.6 trillion, the company trades at 4.6x revenue. Valuations such as this clearly mirror the 1971 – 1972 and 1999 – 2000 eras.
And if one thinks Amazon stands the exception, one would think wrong. A quick look at Zoom’s valuation reveals similar aspects. Zoom’s stock trades at $269. According to the analyst community, Zoom will earn $1.25 – $1.50 in “Adjusted Earnings” this year, as the pandemic propels their business forward. With the pandemic going away by next year, earnings in 2021 will remain flat according to most analysts. In addition, GAAP Earnings will only equal $0.75 – $1.00 this year. The market capitalization is $76 billion on just $1.8 billion in projected revenue this year. So, applying similar metrics to Zoom as to Amazon results in the following statistics: P/E = 192.1x Adjusted Earning and/or the P/E = 298.9x GAAP Earnings. Further, the equity trades at more than 42x Revenue.
Tesla also provides a study in valuation. With the stock trading at $1,394, its market capitalization of $258 billion now comfortably exceeds that of Toyota at $170 billion. The company will earn ~$4 in Earnings in 2020 and $8 in 2021. They will do Revenue of $29 billion this year. Based on this data, Tesla trades at a P/E of 348.5x this year’s estimates and only 174x next year. Furthermore, it trades at 8.9x Revenue. In contrast, Toyota trades at 7.5x 2020 Earnings and 0.6x Revenue. And while Tesla stands as a leader in Electric Vehicles (EVs), Toyota will rollout many EVs over the next 2 years.
Given these valuations, private companies continue to seek liquidity for their owners. Palantir just made a private filing with the SEC to go public. According to the company, they will generate $1 billion in revenue this year. While no earnings data is publicly available, some reasonable guesses could be made based on currently public software companies. For example, Amazon Web Services possesses a 27% operating income margin. SAP possesses a 20% operating margin. Microsoft possesses a 34% operating margin. All these companies possess scale at multiples of Palantir’s revenue. However, taking the midpoint of these margins gives 27%. This means Palantir would earn close to $270 million in operating income. Assuming just a 20% tax rate, Net Income would equal $216 million for 2020. Based on leaks in the press, the company will seek to price its Initial Public Offering (IPO) at over $20 billion. Such a valuation would mean the stock will trade at a P/E of 92x and over 20x Revenue.
For investors, Dreams dominate today as investors look to these companies as the One Decision Stocks of 2020 similar to the list that Morgan Grenfell created in the 1960s that became the Nifty 50. With today’s Dreams now trading like the Nifty 50, imagining a repeat performance over the next 5 years seems easy to do. However, as history teaches, such eras are fleeting. And, when they come to an end, the tears of investors pour forth voluminously as they bewail a bygone time. For investors To Dream The Impossible Dream of an encore performance will bring back the words of that immortal song as the era comes to an end in a repeat performance of the 2001 – 2003 bear market or the 1973 – 1974 wipeout. And, when this comes, investors will repeat to themselves over and over the line: “To bear with unbearable sorrow,” as the Dreams come to an end and a new reality forces its way into the markets. (Data from Yahoo Finance, Seeking Alpha, company financial reports, and public sources coupled with Green Drake Advisors analysis.)
Serving Up Memories, To RV or Not To RV, and The Bionic Human
Finally, we close with brief comments on Serving Up Memories, To RV or Not To RV, and The Bionic Human. First, server demand continues to explode driven by the use of video-conferencing services due to the pandemic. The top 4 internet service providers cap ex rose over 40% year over year. This growth concomitantly carried along everything that goes into a server, including memory chips. As a result, demand for memory is projected to rise 15% in 2020 and over 20% in 2021. We see the market Serving Up Memories. Second, demand for new RVs has collapsed and now resembles data from 2009. After that collapse, the industry saw a massive recovery. While the consumer answers no today when asked, To RV or Not To RV, we see that changing as the economy recovers and the industry enjoys a classic recovery. And Third, scientists from Nanjing and Macau performed an amazing transformation in mice. By injecting a tissue extract into the spleen they created a matrix into which they injected liver cells. These cells then grew into a liver like structure, essentially transforming the spleen into a liver, as reported in the journal Science Advances. We see this as one more step on the path to The Bionic Human.
Confidential – Do not copy or distribute. The information herein is being provided in confidence and may not be reproduced or further disseminated without Green Drake Advisors, LLC’s express written permission. This document is for informational purposes only and does not constitute an offer to sell or solicitation of an offer to buy securities or investment services. The information presented above is presented in summary form and is therefore subject to numerous qualifications and further explanation. More complete information regarding the investment products and services described herein may be found in the firm’s Form ADV or by contacting Green Drake Advisors, LLC directly. The information contained in this document is the most recent available to Green Drake Advisors, LLC. However, all of the information herein is subject to change without notice. ©2020 by Green Drake Advisors, LLC. All Rights Reserved. This document is the property of Green Drake Advisors, LLC and may not be disclosed, distributed, or reproduced without the express written permission of Green Drake Advisors, LLC.