Global Economic Quarterly: Now Exiting the 1960s and Entering the 1970s, A New Decade and A New Economy

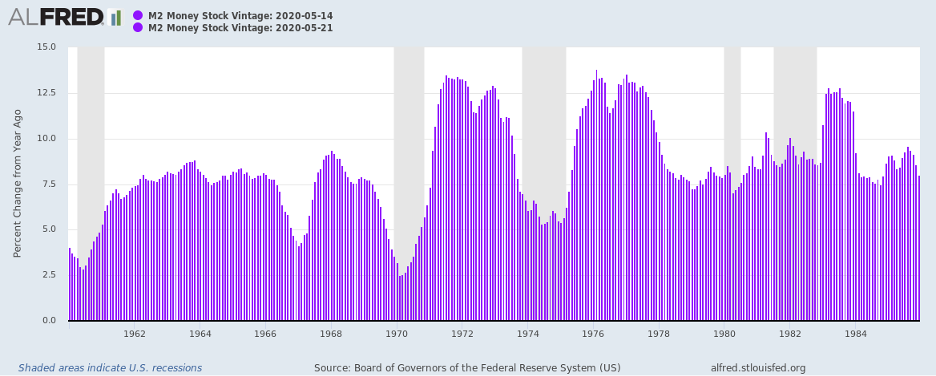
For those who wish to understand where the global economy sits, imagine the late 1960s. Things appear going well, but tensions are brewing beneath the surface. The gold standard, which anchored the value of the U.S. Dollar and the global monetary system since World War II, stands under attack. Social unrest runs rampant, with riots in the streets. Proxy Wars continue around the world. The Hong Kong flu epidemic is just over. And the Global Economy stands in recession. In response, the U.S. Federal Reserve ramps Monetary stimulus to the economy. M2 growth accelerates from 2.5% in early 1970 to almost 13.5% by mid-1971. Inflation follows with a lag forcing the Federal Reserve to tighten monetary policy starting in early 1973 and not ending until mid 1974, creating another recession in late 1973 that will run until the beginning of 1975.
Fast forward to today. The Federal Reserve grew the Monetary Base from $832 billion in 2008 to almost $4.2 trillion in 2015. It then tightened from 2016 – 2019, shrinking the Monetary Base to just $3.2 trillion or by almost 25%. As in past periods of monetary tightening, this led to a recession. In response, the Federal Reserve exploded the Monetary Base this year, with the Monetary Base growing from $3.2 trillion in October 2019 to over $5.2 trillion today. In other words, in just 7 months, growth exceeded 60%.
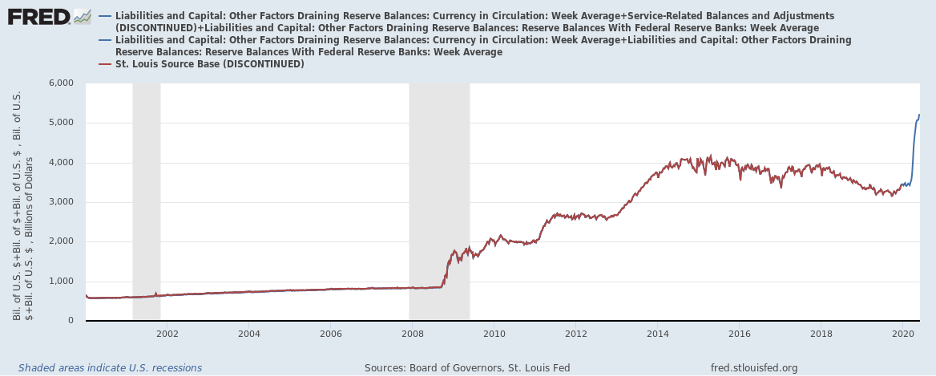
If we were to smooth this growth from 2015 to today, it would average just 4.4%. However, in exploding Money then contracting it then exploding it again, the Federal Reserve created ripples in the real economy with significant repercussions. And these repercussions, as in the past, would have occurred with or without the current epidemic, which just exacerbated their actions. (Those with a keen eye could discern that the Monetary Base bottomed in late 2019 and was already expanding before the current emergency liquification of the economy.) With the normal lag, these actions should accelerate the real economy.
If we add to these actions of the Federal Reserve, actions overseas by other Developed Economies’ Central Banks, money growth continues to explode for these countries as well. The European Central Bank (ECB) just announce another €500 billion injection into the European economy. This stands on top of €750 billion in former stimulus, bringing their total to €1.25 trillion ($1.4 trillion). The Bank of Japan (BOJ) doubled the size of its corporate bond and commercial paper to ¥20 trillion and announced it would buy an unlimited amount of government bonds. The Bank of England announced liquidity measures equal to almost 15% of GDP so far ($430 billion). The Bank of China eased Required Reserve Requirements and will allow the Shadow Banking system to grow for the first time in many years. Furthermore, China’s Total Social Financing will grow over 13.5% this year.
On the Fiscal side, the numbers are just as large. the European Union announced a €750 billion ($850 billion) stimulus package. The Japanese government announced a $1 trillion stimulus. China’s government deficits will total over 15% of GDP this year. The US already put in place over $3 trillion in spending with potentially more coming down the pike. The UK budget deficit will total over 16% of GDP. India recently announced a 10% of GDP stimulus. In a word, countries cumulatively will stimulate their economies at 2x – 3x the levels relative to GDP during the 2008 – 2009 Recession.
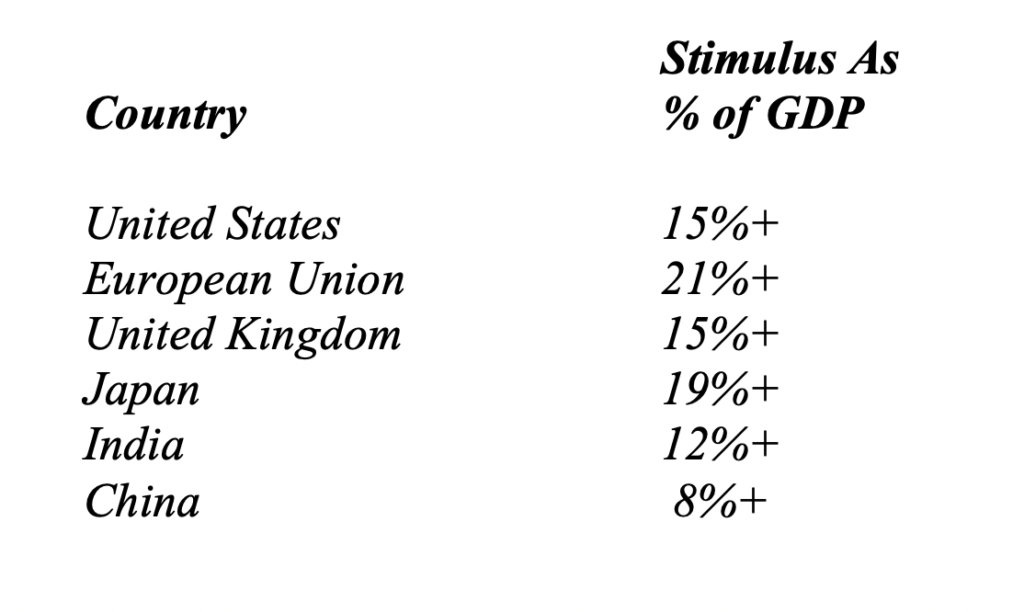 In fact, when coupled with Central Bank actions, Total Liquidity Plus Fiscal Stimulus could approach 25% of Global GDP. With numbers these massive, the positive impact on the Global Economy just remains a matter of time.
Dragon Chains
While the economy in China appears to have returned to steady growth mode, on a year-over-year basis, after a brief dip earlier this year, underlying economic statistics show a more mixed picture. And when the massive amounts of government stimulus get taken into consideration, there exist real questions as the true strength of economic growth. Furthermore, with Foreign Direct Investment beginning to slow, low labor cost advantages gone or greatly diminished, and global supply chains relocating outside the country, economic growth in China finally may have begun the long expected, inevitable deceleration over the long term to a sustainable level of growth.
To understand the scale of the government actions, one need only look at the various components and add them up. First, China cut taxes to support the economy, with tax cuts equivalent to 1.6% of GDP. Second, the central government supported the issuance of RMB 3.5 trillion in Local Government Bonds, equivalent to 3.5% of GDP, and RMB 1.0 trillion of additional Special COVID-19 Bonds, equal to an additional 1.0% of GDP. In addition, the government announced additional spending across a number of categories, including infrastructure, equal to another 1.5% – 2.0% of GDP, depending on what assumptions are made. This brought the Augmented Government Budget Deficit to 15.1% of GDP and overall direct government spending to over 35% of GDP. This excludes spending in government controlled businesses which comprise anywhere from another 20% to 30%+ of the economy, depending on who is doing the counting. And in support of this spending, Total Social Financing is expected to grow 13.5% year over year despite growth likely ending up below 5% for the year, continuing the rise in Debt to GDP and fueling over 100% of growth.
For those who need a reminder that China continues a command economy, a brief digression to the country’s economic data stands in order. An interesting starting point is the trade statistics. For May, exports fell just 3.3% year-over-year while imports magically descended 16.7%. This enabled China to grow its Merchandise Trade Surplus to over $63 billion that month and bring its 3 month average to ~$43 billion. We would note that China’s merchandise trade surplus magically averages $40+ billion, despite various countries efforts to rein in the country’s exports for years. Infrastructure investment accelerated as well. It now stands up over 8% year over year. New government incentives for autos drove auto sales up 14.7% year over year. However, in the areas outside the government’s control, the data look less rosy. International Tourism remains down over 50%. Domestic flights remain relatively empty. Hotels continue to show only modest recoveries in occupancy. Coal Consumption remains down 9% to 10% year over year. And chemical production stands down year over year. So, in the data the government cannot control, things look decidedly more mixed, if not negative.
This latter point makes sense given the state of the global economy. While it continues to recover from the shock of late Q1, it remains in recovery mode, well below year ago levels. And with China dependent on trade for a significant portion of its economy, this drag will not disappear anytime soon. And even when it does, fundamental economic growth will now depend on domestic consumption, as the relocation of supply chains away from China coupled with trading partners, such as India, disengaging for political reasons, this investment to consumption transition will likely create a drag given the relative size of the two. With clear changes in how the economy must function, these factors will act as Dragon Chains, preventing the economy from achieving its prior growth trajectory.
The Sun Also Sets
For Japan, life under the Prime Minister Abe looked like a mini-version of old fashioned pump priming. The government issued currency, borrowed more, and, most importantly, spent more. And the Bank of Japan financed the spending by buying all the government debt issued to fund this. However, economic reality continued to interfere with these bold new plans. Competition from China and other Asian nations put a crimp on Japan’s exports. Demographics also created a large drag. And, ultimately, taxes needed to rise to pay for all that government largess. Despite the government’s best efforts, Japan entered a recession in Q4 2019, well before the hit from the epidemic, with Real GDP falling year over year. Current economic projections show this year over year fall continuing through the end of 2020, despite what is expected to be a bounce from the bottom in Q3 and Q4. All-in-all, Japanese GDP in Q4 2020 will stand 4% – 5% below year ago levels.
For Japan, this will erase several years of economic growth and will bring into question the policies followed by the current government. These policies, while reviving the economy short term through higher government spending, did not solve Japan’s fundamental problem. This relates to the country’s global competitiveness for its export oriented economy in an era in which multiple new country competitors, to further their economies, attempt to wrest key end markets away while subsidizing their industry and protecting their home markets. One should note that this combination of policies mimics those followed by Japan during its economic rise from the 1960s to the 1990s. Thus, Japan must drink its own medicine, but handed out at the hands of competitors. With the government not yet addressing its fundamental problems, the country now stands as one in which The Sun Also Sets, leaving its leaders with no good political options.
Elephant Rides
India’s attempt to deal with the global epidemic, through a lockdown, did not fare well. Industrial Production collapsed and the economy with it. As an example of the impact, Electricity consumption declined 24% year-over-year in March and April. Realizing its error, the Elephant of Southeast Asia, after coming to a screeching halt, reversed course, reopening as rapidly as it could. Also, to avoid bankrupting the millions of small businesses in the country, the government announced a Rs 3 trillion ($40+ billion) working capital enhancement scheme with free loans worth up to 20% of a company’s working capital. In addition, the government implemented debt moratoriums for borrowers. It is estimated that 31% of private bank loans and 39% of public bank loans currently fall under this category. Lastly, the government announced a 10% of GDP stimulus program. This represents an additional 5%+ of GDP in spending on top of the 4.9% of GDP actions already taken. (In dissecting the announced plan, only half of it represents additional actions to be taken.) With Indian economic growth already slowing to just 4.4% of GDP year-over-year in Q4 2019, India registered its slowest year of Nominal GDP Growth since 1972 in F2020, with Nominal GDP Growth of just 7.2%.
One way India typically addresses slow growth comes through the currency. The Elephant’s Real Effective Exchange Rate stands near the highs recorded in 2011 and 2007, according to BIS (Bank for International Settlements) data. After each time it reached these levels, the currency fell over 15% in real terms, aiding economic growth. With India’s currency down 5% in 2020 and the worst performing currency in Asia this year, the currency likely will continue under pressure as the government searches for options to reignite growth. With the changes in policy coming rapidly, Elephant Rides are likely to get bumpy over the next few years.
Tiger Growls
For the countries of Southeast Asia, the epidemic led to a mixed bag of results. For some economies, such as Thailand, which are heavily tourist dependent, it turned into a nightmare. Tourism collapsed, with calendar 2020 visits expected down 70%, even with a rebound in the second half of the year. Reflecting this impact on the economy, car sales fell 51% year-over-year in May. For other countries, such as Indonesia, there never occurred a lockdown, merely a closure of the borders. Thus, Indonesia followed Sweden’s example, eschewing a closure of its economy and the associated costs. As a result, its economy, despite a difficult Q2, is projected to grow ~1% in 2020. With only 11 deaths per million population and a relatively young demographic, it chose a small social cost, which might not show at all in the annual deaths, instead of a massive economic one. Other countries, such as Malaysia, closed their economies temporarily and are now reopening. Malaysia’s economy is forecast to shrink by 3.5% this year, as a result. In response to the virus and its impact, Malaysia’s government, like many around the globe, announced a massive stimulus, equal to 20% of GDP. This should ensure the economy reaches a stable growth footing by later this year. The Philippines did something similar. However, despite the lockdown, cases continue to rise in the country. Interestingly, the death rate did not rise in conjunction, indicating that the relatively young population continues to provide the best immunity possible to the virus. The government also announced a large stimulus recently, equal to 9% to 10% of GDP. Other countries in Asia, such as Korea, Singapore, and Taiwan show similar stories. The only major difference between these countries originates in Taiwan, where a major reshoring initiative continues to undergird that economy. With these Asian economies showing flesh wounds with quick healing ahead, Tiger Growls will soon be heard once more.
Party Interrupted
For Brazil, the Party stands Interrupted as the band took a break. With the virus spreading rapidly, Brazil’s retail sales and industrial production took a major hit in April and May, down over 20% year-over-year. This drop occurred due to both the Brazilian economy suffering from the initial shock of COVID, but other Latin American economies, such as Chile, Columbia, and Peru, facing similar challenges. For Brazil, this impact occurred after the economy had already fallen in Q1, year-over-year, as China, one of its major trading partners, shut down. Despite the continued growth in cases in late Q2, the government moved to reopen the economy with a similar view as many other Emerging Economies. The economy cannot stand the cost of shutdown. In addition, to offset the costs of the epidemic, the government announced stimulus measures that will bring the budget deficit close to 10% of GDP, as in many other countries around the world. And the Central Bank lowered rates aggressively. In addition, with the currency value cut in half, Brazilian agriculture and industry became hypercompetitive on a global basis, which will play out as the globe recovers. Despite this, with the Party Interrupted, there likely will occur no revelry until 2021, when the economy shows a true recovery.
Lions Tamed
For Africa, the disease represents a real threat. Without the health facilities that exist in the Developed Economies, the virus coupled with the collapse in commodity prices, such as oil, will produce a severe impact on these economies. For example, prior to the virus, Nigeria’s expected economic growth for 2020 stood at 2% – 3%. Now, the economy is expected to contract at least 3% if not more for the year. (See the following World Bank article: https://www.worldbank.org/en/news/press-release/2020/06/25/nigerias-economy-faces-worst-recession-in-four-decades-says-new-world-bank-report .) Other nations on the African continent face similar hits to growth. Kenya, the largest economy on Africa’s East coast, was originally expected to grow 6% in 2020. Recent projections now expect only 1% growth at best, with the potential for a contraction of over 1%. ( Please see the following recent article on Reuters: https://af.reuters.com/article/idAFKCN22B0SG-OZABS .) Tanzania will show a similar drop, from ~7% to just 2% growth this year. Ethiopia now will grow less than 3% compared to initial projections of 6% to 7%. Other countries such as Ghana, Zambia, and South Africa will show similar hits. And, while the overall region’s economy should show resiliency similar to Asia, economic growth in individual countries will take a hit of anywhere from 4% to 6% this year, depending on the country. With such an outcome, we see the Lions Tamed by the virus, at least over the short term.
The Old Man: Along Came A Virus
For Europe, the hits keep coming. After a debt crisis with Greece, narrowly avoiding a split with Italy so far, and having the UK leave, Along Came A Virus. The simple way to understand the impact on Europe is the following chart of European Industrial Production:
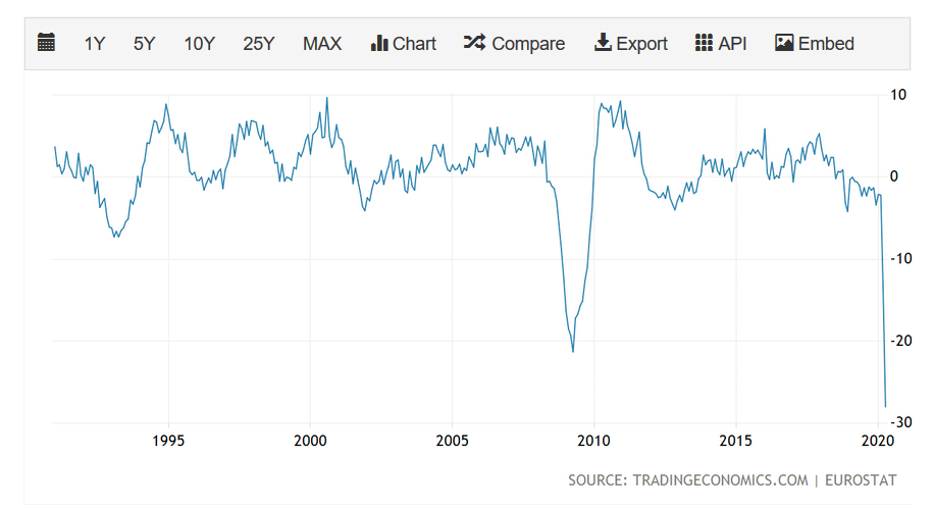
As the above chart demonstrates, Industrial Production already stood in a downtrend prior to the hit from the virus. And the magnitude of the downdraft now exceeds that of the 2008 – 2009 Financial Crisis. Despite actions by the ECB and the European Union to massively support Europe’s economy, it is expected to shrink almost 7% this year. Another glorious outcome in a long period of subpar growth for the economic block since the currency union occurred.
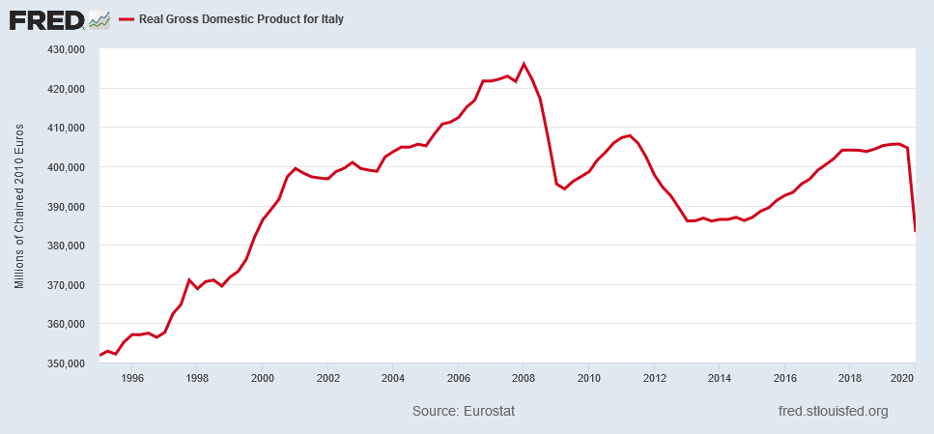
This poor growth will continue to create rising strains within the union. The reason why is simple to understand. For some countries, such as Italy, the whole EU experiment over the past 20 years turned into a disaster. And economic growth massively underperformed growth rates prior to the merger in 1999. For a country like Italy, GDP stands below where it stood in 1999, when the country became part of the block:
At the other end of the spectrum stands Germany. They became one of the prime beneficiaries of the currency union, as it held down its currency value enabling its economy to grow while other economies in the block struggled:
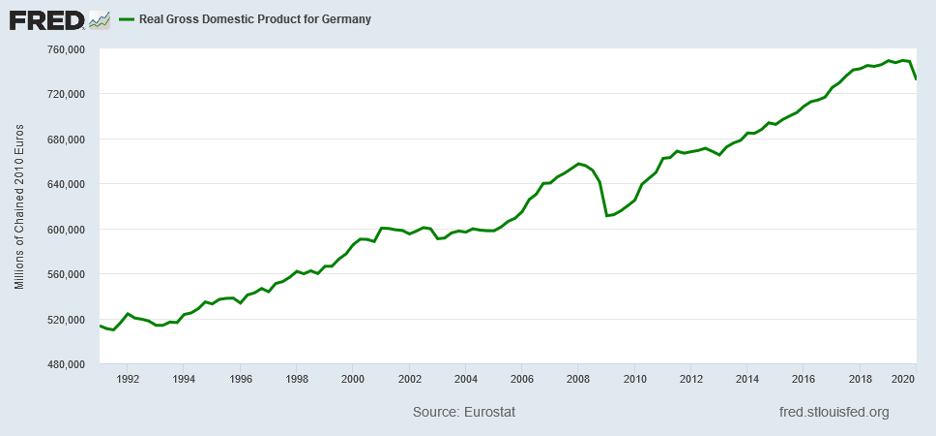
The contrast between Germany and Italy illustrates the fundamental force tearing the EU apart. Germany’s GDP stands almost 27% above where it ended 1999 as of Q1 2020. And Italy’s GDP stands 4% below that level. The following chart illustrates this stark difference in outcomes:
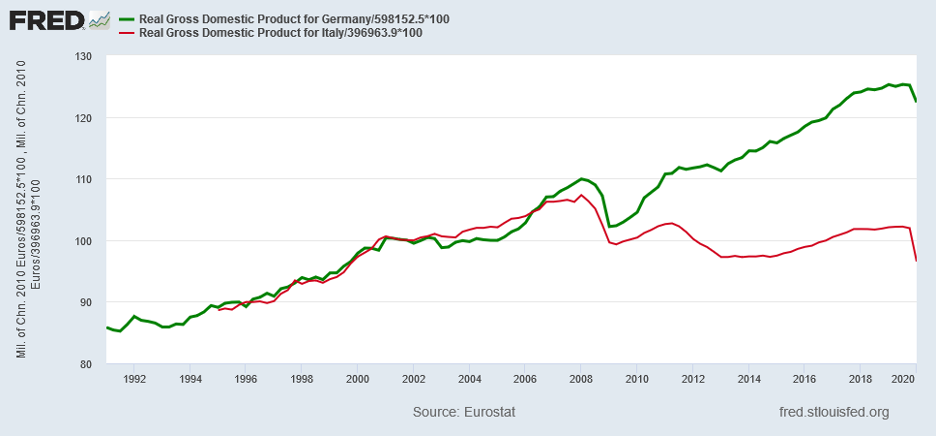
For the EU to remain as one and not return to its prior political arrangement as just a trading union, known as the European Common Market, this difference in economic performance must close. And to do so, a path to closure must exist that does not exist today. Should the current state of affairs continue, countries like Italy, in a purely rational action, will exit the European Union and recreate their local currencies, in this case the Lira. In fact, in preparation for this potential move, Italy already created the BOT, a pseudo-currency, which is the Lira in all but name. It merely needs to expand the uses of this new legal creature to become a true currency. And if Italy exits, so will Spain and Portugal, with other countries, such as Greece, considering their options. For the EU, Along Came A Virus that highlighted and exacerbated the fundamental economic issues and which may precipitate the breakup long predicted by many.
Beginning a New Climb
For the United States, the recession looks very familiar. It appears a short sharp recession with GDP recovering to prior levels within 6 quarters. (Please see The Phone Stopped Ringing, April 16, 2020.) This would put the US economy at new heights in Q2 2021. This timeline, interestingly, coincides with the timeline for a vaccine, which likely will arrive in Q1 2021 with much of the populace vaccinated by the end of Q2. Thus, areas held back by fear of contact until then, such as hotels, airlines, restaurants, sporting events, concerts, …, will experience a massive snapback in the first half of next year, normalizing the last portion of the economy to exit the recession this time.
A look at some of the economic indicators demonstrates how normal this recession appears. First, auto sales took a drop similar to 2008:
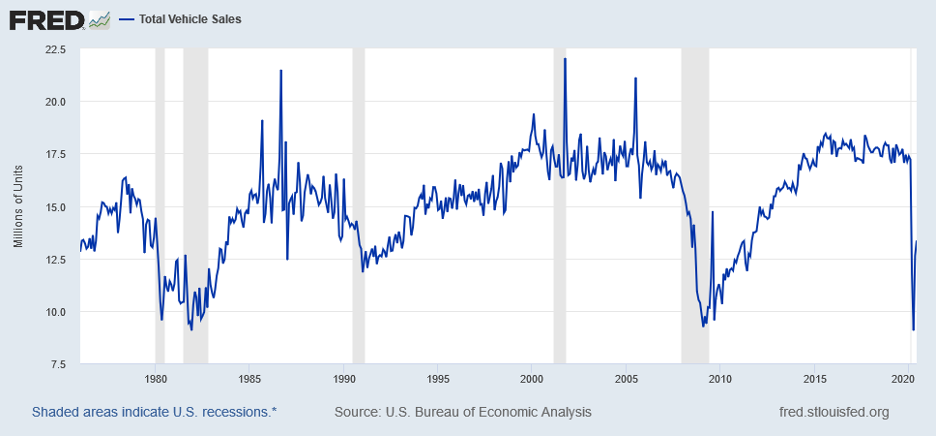
And it is rebounding in a similar way to then and prior short sharp drops. If one then looks at Housing Starts data, something similar appears:
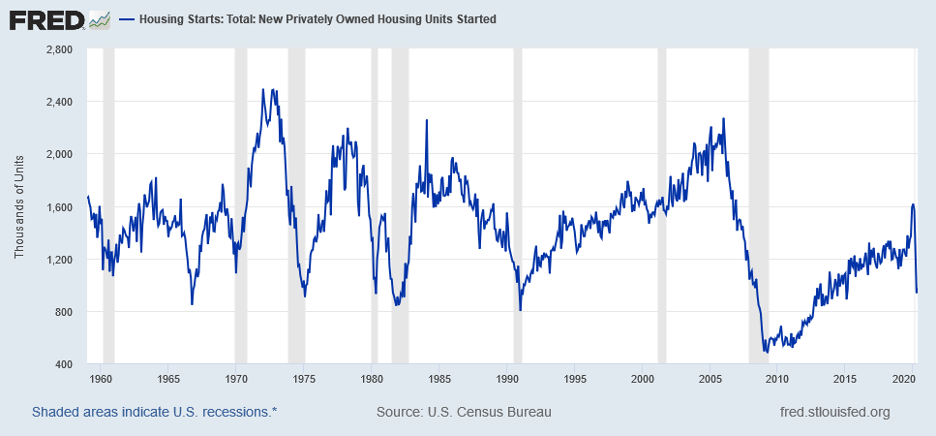
The data looks like prior downturns from the 1960s, 1970s, and 1980s. Industrial Production paints an awfully similar picture:
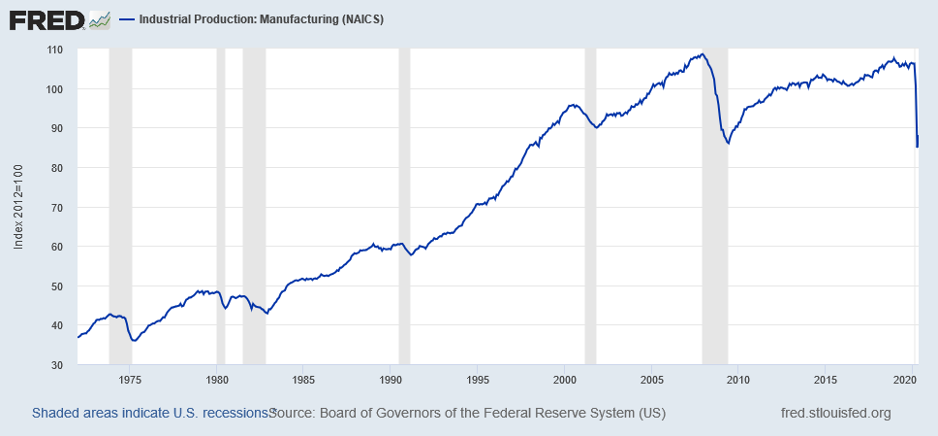
And lastly, the Manufacturing PMI, indicates a classic recession pattern:
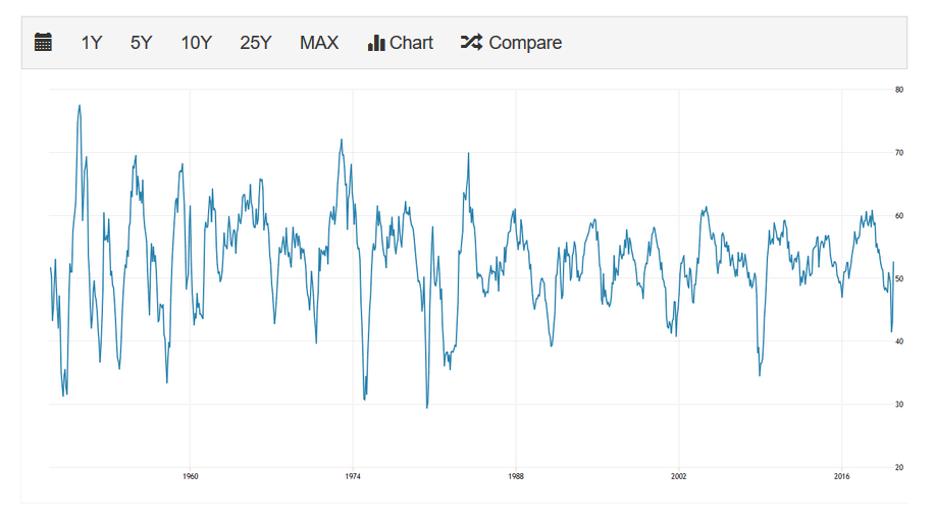
Chart Courtesy of tradingeconomics.com.
The manufacturing sector experienced its typical sharp drop followed by a sharp rebound, as occurred in most recessions since World War II.
While the media is filled with news about the Coronavirus, it ignores all the classic signals presented by the economic data indicating that, for the U.S., this appears just another typical recession. And, unlike the media, the equity markets recognize this reality, having recovered much of their dip from earlier this year. With other leading indicators, such as money growth, continuing to demonstrate rapid recovery, the data should continue upward in the classic sharp initial stages of recovery. And with the U.S. seemingly on track to reach new heights by Q2 2021, America is Beginning A New Climb. (Data from the Federal Reserve, Eurostat, World Bank, and other public sources combined with Green Drake Advisors analysis.)
Confidential – Do not copy or distribute. The information herein is being provided in confidence and may not be reproduced or further disseminated without Green Drake Advisors, LLC’s express written permission. This document is for informational purposes only and does not constitute an offer to sell or solicitation of an offer to buy securities or investment services. The information presented above is presented in summary form and is therefore subject to numerous qualifications and further explanation. More complete information regarding the investment products and services described herein may be found in the firm’s Form ADV or by contacting Green Drake Advisors, LLC directly. The information contained in this document is the most recent available to Green Drake Advisors, LLC. However, all of the information herein is subject to change without notice. ©2020 by Green Drake Advisors, LLC. All Rights Reserved. This document is the property of Green Drake Advisors, LLC and may not be disclosed, distributed, or reproduced without the express written permission of Green Drake Advisors, LLC.