Equity Markets: 1999 – 2000 Again or The New Nifty 50

“John Bull can’t stand two percent.”
Old Wall Street Saying
“My fifth point is performance contains the seeds of its own destruction. As more and more institutions get into the act, the more likely it becomes that performance will go the way of all previous investment fads. The first practitioners at least were trading in and out of high-grade, readily marketable, seasoned growth companies. As others joined the parade, the emphasis moved along to secondary securities. Now, with everybody jumping on the bandwagon, the trend is toward highly speculative issues of fledgling companies with very limited marketability. With many of these stocks selling at 50 to 100 times earnings and 10 to 15 times sales, performance may already be running its string.”
David L. Babson
First Annual Institutional Investor Conference, January 31, 1968
Institutional Investor Inc.
As Quoted by:
Classics: An Investors Anthology
Edited by Charles D. Ellis, 1989
Nothing new ever occurs in investing. Economies rise and fall and with them interest rates and growth. Companies pile on debt in good times, only to find them anchors pulling them under the water in bad times. And company valuations move from the depths of despair during recessions to the heights of exuberance during economic booms. And whether one reads Common Stocks as Long Term Investments, written by Edgar Lawrence Smith in 1928, or Ben Graham’s and David Dodd’s critical comments on Smith in their 1934 classic, Security Analysis, little changes in investing.
To illustrate this point, one need only examine the current valuation on the Equity Markets. And one of the best long term valuation methodologies continues to be Robert Shiller’s CAPE, Cyclically Adjusted Price Earnings Ratio. While the CAPE does not predict short term movements in the markets, the valuations provide a reasonable read on 10 year forward Equity Returns, with strong statistical support. The current chart looks as follows:
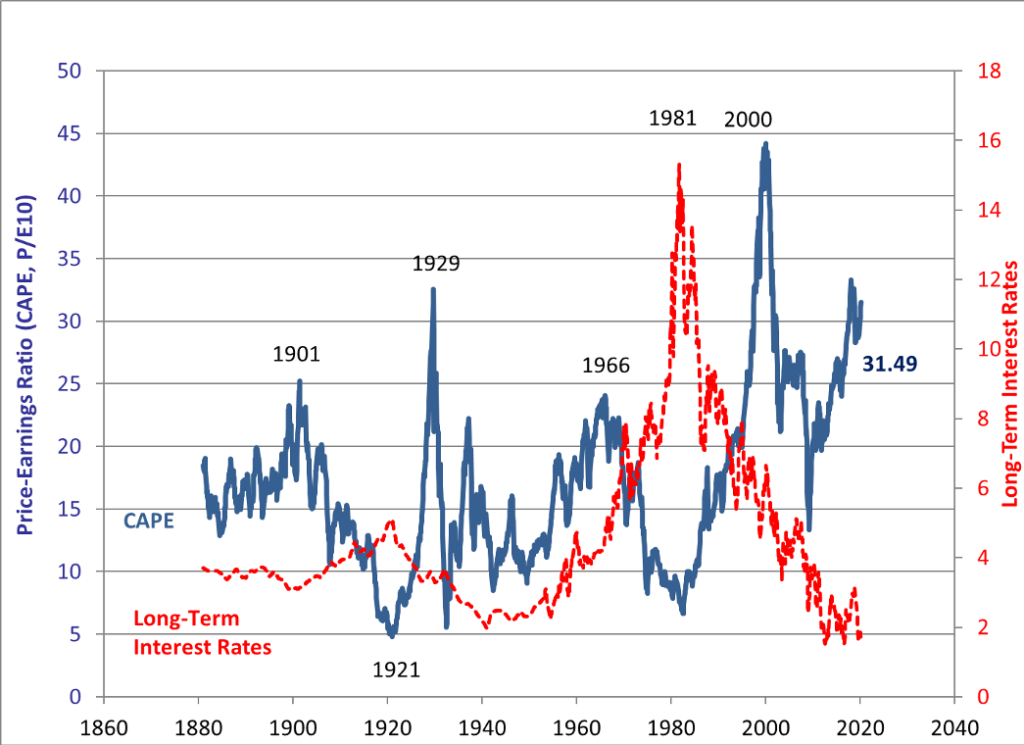
Chart courtesy of Robert Shiller, Yale University and can be found at: http://www.econ.yale.edu/~shiller/data.htm
As the latest data shows, the current CAPE Valuation equals 31.49. This is the same value as in August, 1929 which, in that stock market bubble, only was exceeded in September, 1929 at 32.56. For points of reference, the 1901 peak valuation occurred at 25.24 and in 1966 at 24.06. And the ultimate mania in the past 150 years, the 1999 – 2000 Tech Bubble, reached a peak of 44.20 in December 1999. From these types of starting valuations, 10 Year Forward Returns typically produce zero or negative Nominal Returns and uniformly negative Real Returns. In other words, investors holdings decline in real value over the next decade. And this should come as no surprise. Overpaying for any investment, no matter how good the company, typically leads to poor returns. For example, if an investor sold her or his equity holdings in 1997 when the market hit its 1929 CAPE valuation, it would have taken until 2011 for the value of the market in real terms, assuming an investor reinvested his or her dividends, to reach its 1997 level.
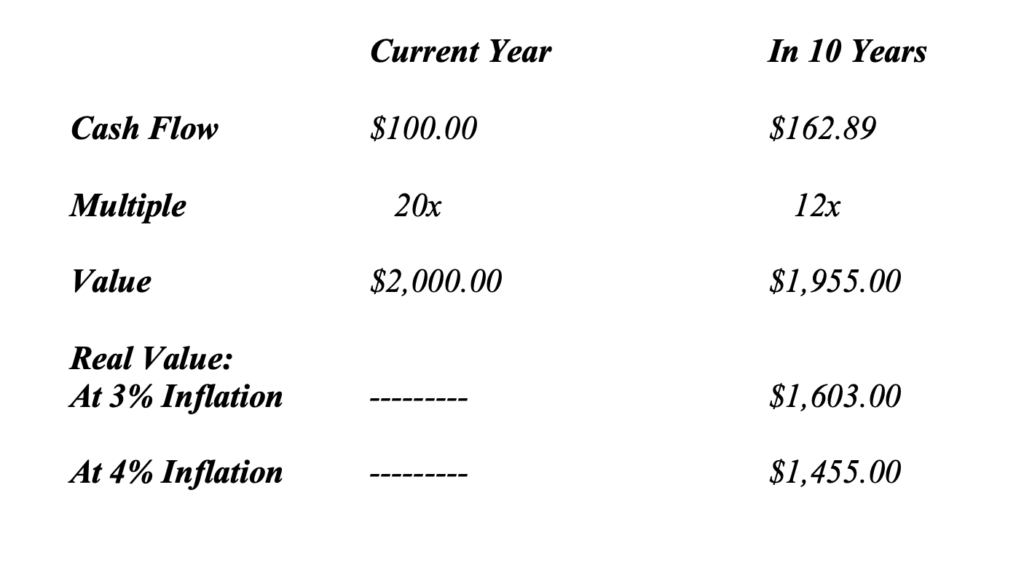
The CAPE graph also illustrates reversion to the mean in overall valuations. Within a decade of each peak in CAPE valuation at these types of levels, valuations drop over 50%. This type of valuation decline undermines the ability of investments to produce positive real returns. The impact of such a valuation decline can be shown in the following illustration. Imagine an investor owns a building that throws off $100 in Cash per Year. Assume the building is valued at 20x its cash flow today, similar to a 5% cap rate. (Please note: actual cap rates stand below this for a significant portion of the real estate market today.) That means the building is worth $2,000 today. If Cash Flow grows 5% per year for a decade, the building will produce $162.89 in Cash per Year in 10 years. Let’s assume valuations fall to 12x cash flow or cap rates rise to 8.5%. This would equate to a drop of only 40% in valuations. This means the building valuation would only equal $1,955 in 10 years or a little over 2% below today’s valuation. If inflation averages just 2% over the decade, the price level rises almost 22%. This means the real value of the building falls to just $1,603 and the investor suffers a real decline of almost 20% in their investment. If inflation averages 3%, then the price level rises over 34%. This would lower the real value of the building to $1,455 or by more than 27% compared to today’s valuation. The following table illustrates this example:
While investors always assume that valuations can continue at high levels in the midst of bull markets, history demonstrates a different lesson, a painful one that each generation of investors seemingly must learn over for themselves as its 1999 – 2000 Again.
If today’s market valuation resembles 1999 – 2000 or the 1929 Market, the massive concentration of the market resembles the Nifty 50 of the late 1960s. The Nifty 50 stocks, on average, traded at 42x earnings with highflyers like McDonalds trading at 86x, Polaroid at 91x, and Avon Products at 65x. Of course, these stocks produced strong fundamental growth in the 1960s that led Morgan Guaranty Trust to issue its famous list of 50 stocks that also included names such as Disney, Dow Chemical, General Electric, and Phillip Morris. This worked until the 1973 – 1974 Bear Market, in which these stocks fell precipitously in a similar manner to the technology stocks in the 2001 – 2003 Bear Market. Today, numerous growth stocks trade at valuations similar to those of the late 1960’s Nifty 50, effectively creating a New Nifty 50. The lowly valued growth stocks, such as Microsoft, trade at 27x – 30x earnings. The more highly valued trade at 70x 2020 estimated earnings or more. These include Amazon at 83x 2020, Netflix at 89x, Tesla at 285x, and Zoom Video at 400x. All of these companies have demonstrated growth over the past five years leading investors to provide them high valuations. Unfortunately, the history of these types of valuations tends to produce poor results over the long term in aggregate.
For investors, the Equity Markets stand in a late cycle position. Long term valuation measures, such as Shiller’s CAPE, mimic those values seen at or near prior peaks. The S&P 500 looks much like 1999 – 2000, with the Top 5 Stocks by market cap all Technology companies (Microsoft, Apple, Amazon, Facebook, and Google) and Technology comprises the largest percentage of the market since then. Valuations resemble those last seen during the reign of the Nifty 50 in the late 1960s/ early 1970s, when a diversified crop of growth companies dominated the market. Given this backdrop, investors likely stand in a similar position to those in 1967 or 1999. While the market rose from those levels, ultimately the economic fundamentals eroded leading to a recession and bear market. With the fundamentals beginning to erode for the economy, investors must watch for the appropriate time to exit lest they get caught in the next downdraft. Until then, the New Nifty 50 will reign. (Data from public sources coupled with Green Drake Advisors analysis.)
Confidential – Do not copy or distribute. The information herein is being provided in confidence and may not be reproduced or further disseminated without Green Drake Advisors, LLC’s express written permission. This document is for informational purposes only and does not constitute an offer to sell or solicitation of an offer to buy securities or investment services. The information presented above is presented in summary form and is therefore subject to numerous qualifications and further explanation. More complete information regarding the investment products and services described herein may be found in the firm’s Form ADV or by contacting Green Drake Advisors, LLC directly. The information contained in this document is the most recent available to Green Drake Advisors, LLC. However, all of the information herein is subject to change without notice. ©2020 by Green Drake Advisors, LLC. All Rights Reserved. This document is the property of Green Drake Advisors, LLC and may not be disclosed, distributed, or reproduced without the express written permission of Green Drake Advisors, LLC.