As The Cycle Turns: 2001, A Stock Market Odyssey & Everyone Into The Rental Pool

Every cycle possesses an asset whose ability to deliver returns no one can deny. It creates strong returns for early and mid-cycle investors, but then attracts gobs of capital late cycle that drive returns downward, just as the fundamentals turn against the asset. In the 1980s, leveraged buyouts and commercial real estate, principally office buildings, attracted significant capital. For those early on, this produced excellent returns. Companies like Drexel Burnham Lambert rose to prominence financing these deals. However, in the late ‘80s, deals got bigger and bigger, as did leverage, in order to make these deals work. And, as these investors found out, leverage cuts both ways. In the ensuing recession, investors lost 100% of their investments, numerous insurance companies became insolvent, and many banks disappeared into government receivership. In the 1990s, technology companies, internet companies, and new telecom companies flourished. These companies were value stocks early on and produced fundamentally sound returns. As with most things, Wall Street took a good idea to an extreme, driving valuations to record levels and bringing public companies with no revenue, but large valuations. Of course, they became the Tulip Bulbs of the modern era, with numerous technology companies shutting down and the survivors limping along with revenues often down 80% or more. In the early 2000s, Housing continued its recovery from the 1987 – 1993 downturn. However, instead of allowing the market to have a pullback in 2004, the Federal Reserve allowed lending institutions to loosen standards, creating what came to be known as “Liar Loans”. This enabled homes to become the “Can’t Lose” asset from 2004 – 2007, as traditional lending metrics were discarded. The spectacular rise in home prices, as a result, led to an equally spectacular collapse in values during the 2008 – 2009 recession, as traditional lending standards returned once more. This bankrupted the financial system and caused untold hardship to millions of people.
This cycle, another speculative cycle appears to have occurred in technology companies and venture capital backed companies, with companies such as WeWork trading at $50+ billion private valuations and with companies such as Uber, Beyond Meat, and Slack coming public and trading at nostalgic valuations last seen in the late 1990s and, before that, in the late 1960s, when the GoGo Era of conglomerates, such at ITT, ruled the day. However, as in all speculative cycles, eventually the tide turns. That appears to have occurred over the past year with the failed IPO of WeWork and the disappointing performances of Uber and Lyft since they came public. These companies sold themselves as capturing the markets of tomorrow and were “Willing to lose a little on each sale and make it up on volume.” And with Venture Capital looking for a home for the hundreds of billions of dollars raised from investors, these companies and their founders found willing shareholders who would fund their dreams. These founders understood that when financials did not have to bear the scrutiny of the public markets, this worked, as profits were an afterthought. And while public biotech investors understand that research takes years and the companies might not be profitable until their products receive FDA approval, investors expect public real estate and transportation companies to show profits once they reach some minimal scale, let alone the level of a WeWork or Uber. With WeWork showing massive cash outflows, despite its scale, not only did the company not make it to the public markets but it needed an emergency infusion of cash to stay afloat. And, not surprisingly, Uber’s and Lyft’s stock performances since their IPOs produced negative returns for investors, as they continue to lose money overall. However, with the discipline of public investors, who, for some reason, expect a company to make profits, Uber and Lyft refocused on driving profitability for the first time in their existence. And with the public markets indicating to Venture Capital firms that revenue does not equal profits, a novel idea, and that dreams don’t equate to business valuations, Venture Capital firms pivoted over the past few months. They now demand companies not only show a path to revenue growth but to profits. This change of heart or, more aptly, this change in the pocketbook became the beginning of the end as markets begin to shut to dreams and focus on reality, repeating the lessons from 2001 and sending these dream companies on a Stock Market Odyssey.
And while these Venture Capital companies attracted attention, making the front page of the newspaper, the real capital headed into commercial real estate, where the average investor moved into rental properties over the past few years just as the professional investors, who purchased properties from 2009 – 2011 during the depths of the real estate cycle, exited their properties. For example, Blackstone, entered the home rental business massively in the aftermath of the 2008 – 2009 Housing Collapse, buying tens of thousands of properties between 2009 and 2013 from banks, the government, and through bankruptcy auctions. It then filled them with renters to create a true cash flowing real estate company. In 2017, it took this company, Invitation Homes, Inc., public, as a means to create an independent valuation on the assets and provide for Blackstone’s eventual exit. From March, 2019 through November, 2019, Blackstone sold 100% of its ownership through a series of offerings to the public. All in all it made $7 billion in profits on its investment plus collected dividends along the way.
In addition to numerous professional investors exiting the market, the fundamentals that supported the massive upward move in rental valuations appear at a peak or to have rolled over. First, Gross Rent to Income ratios for the median renter have soared since 2011. In cities such as Boston and New York, this now exceeds 30% of the median income, up from the low 20’s, matching peak rates seen in prior cycles. In some cities, such as Miami, this now exceeds 40%. With lessees complaining about the high cost of rentals, local governments have begun to respond, imposing Rent Controls in a number of cities and mandating legal representation for renters. While this may impact supply over the long term, it will limit the ability to raise rents and to evict residents over the intermediate term. Second, Home Price to Rent Ratios have soared, due to the collapse in interest rates driving home prices to levels well above those of 2007. As a result, Home Price to Rent Ratios stand at 28x in San Francisco, 24x in Fort Lauderdale, and 22x in Atlanta. With prices at these levels, the inverse ratio, Gross Rents to Home Prices sit below 3% in a city like New York (Home Price to Rent Ratio of 34x) and mostly sit between 3.5% and 5.0% for most major cities in the United States. Thus, finding bargain homes to rent at a reasonable return on investment has become much more difficult. Third, Millennials continue to move into their prime home buying years. Statistical data on Millennials demonstrates that they look similar to Baby Boomers, but moved 2 – 3 years later for marriage, kids, home buying, … The latest Household Formation data confirms these statistics, as Millennials continue to form new home owning households at a rapid rate:
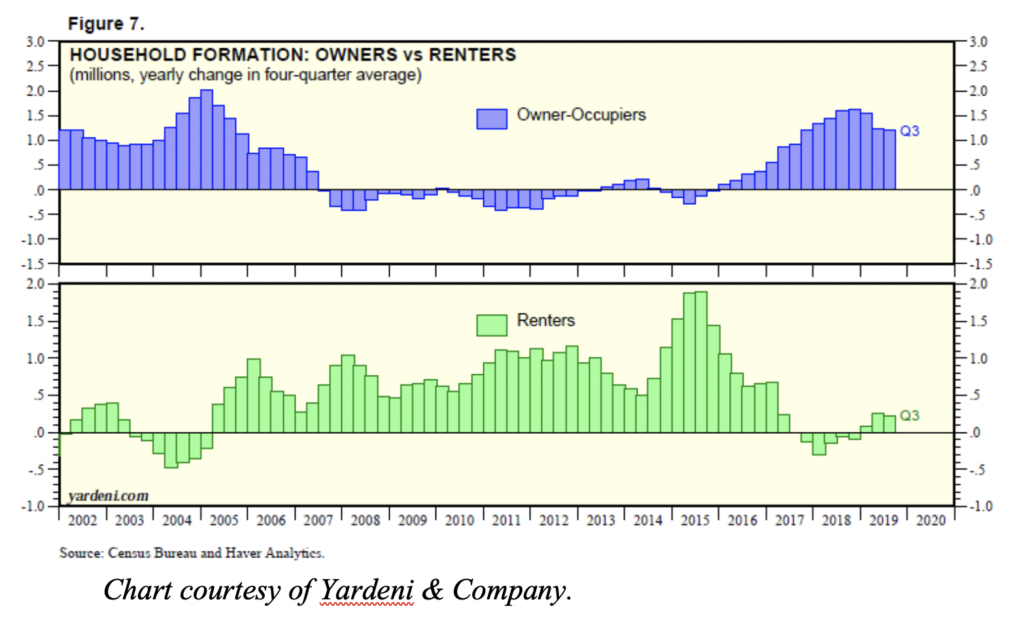
As the chart demonstrates, growth in rental demand collapsed in 2018 and currently sits at very low levels. Fourth, over 19% of U.S. households with incomes over $100,000 rent today compared to 12% in 2006. This represents 3.4 million incremental renters compared to a decade ago. The following chart demonstrates the issue for these first time home buyers:
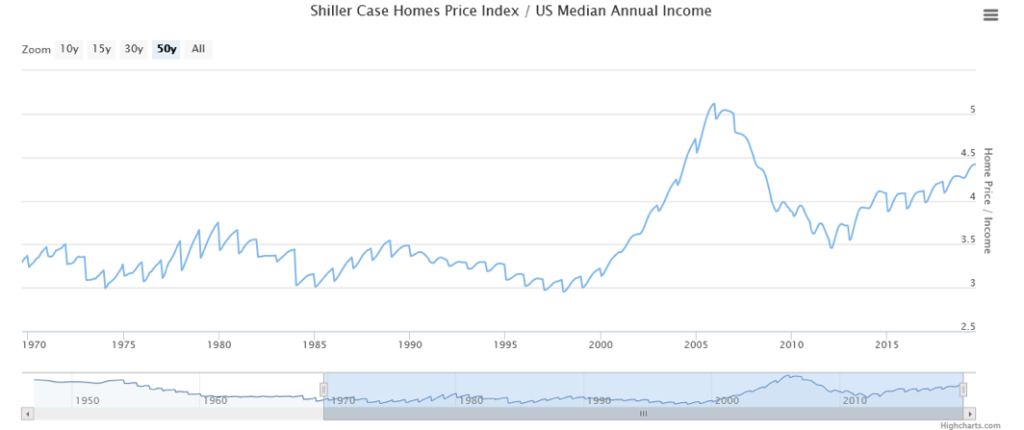
Chart courtesy of longtermtrends.net
Despite the collapse after the Housing Bubble, home prices did not return to their historical relationship to incomes. This shut many first time homebuyers out of the market, as they had difficulty accumulating the necessary down payment. As the major public homebuilders refocused their product on entry level housing over the past two years to meet this demand, the supply for these first time home buyers will start to come to market in 2020 and accelerate thereafter. The new homebuilder focus will enable these renters to locate affordable first homes. Fifth, Multi-Family Housing Permits continue to soar. According to the U.S. Census Bureau, Not Seasonally Adjusted Housing Permits are up 10.2% through November and Starts continue to follow with a lag. And with Multi-Family Housing Starts already exceeding demand growth, the gap will only grow. And Sixth, banks began to tighten terms for commercial real estate loans, as the following chart demonstrates:
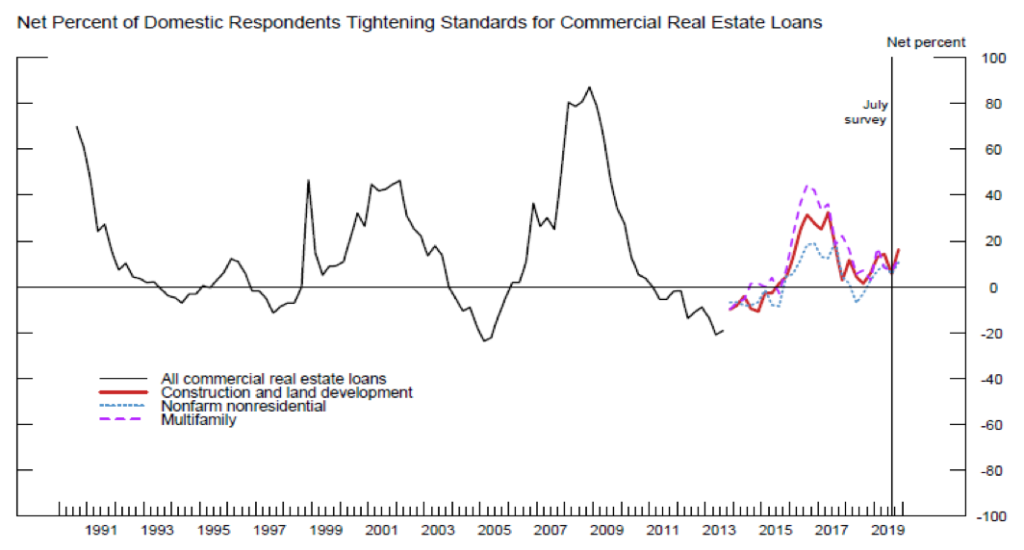
Chart Courtesy of Federal Reserve.
Typically, once this tightening begins, terms do not ease until after the next recession. And as credit tightens, the ability to leverage properties at high multiples of cash flow will become increasingly constrained, likely forcing multiples down.
Despite professional investors exiting and fundamentals turning negative, renting homes continues to attract attention as a “Can’t Lose” proposition. Numerous seminars continue to extol its virtues, given the profits of the past decade. And a whole ecosystem, built over the past decade to focus on this asset, continues to look for new entrants to this market to sustain itself. But with home prices already leveling out or pulling back in a number of major metro areas, home price appreciation may be coming to an end for this cycle. And should mortgage rates rise, with first time home buyers comprising over 50% of all home purchases, further pressure could come on home prices. However, as at the end of most major cycles, money continues to pour into the home rental sector, with the cry, “Everyone Into The Rental Pool”. (Data from US Census Bureau, Yardni & Company, governing.com, rentberry.com, and various publicly published home price data coupled with Green Drake Advisors analysis.)
Confidential – Do not copy or distribute. The information herein is being provided in confidence and may not be reproduced or further disseminated without Green Drake Advisors, LLC’s express written permission. This document is for informational purposes only and does not constitute an offer to sell or solicitation of an offer to buy securities or investment services. The information presented above is presented in summary form and is therefore subject to numerous qualifications and further explanation. More complete information regarding the investment products and services described herein may be found in the firm’s Form ADV or by contacting Green Drake Advisors, LLC directly. The information contained in this document is the most recent available to Green Drake Advisors, LLC. However, all of the information herein is subject to change without notice. ©2019 by Green Drake Advisors, LLC. All Rights Reserved. This document is the property of Green Drake Advisors, LLC and may not be disclosed, distributed, or reproduced without the express written permission of Green Drake Advisors, LLC.