The Coming Global Growth Reacceleration

With the Global Economy continuing to struggle through a slowdown and, in some cases, a recession, like an apartment building on fire, the local fire trucks continue to show up, in the form of Central Banks around the globe, in order to quell the fire and prevent it from spreading to adjacent buildings. Central Banks have begun to pour water onto the flames in terms of lower interest rates, increased money supply, and higher credit availability. And, while this continues to hold the flames at bay, they await their larger brethren to truly put the flames to rest. The hook and ladder companies have been called, in the form of government spending, and are on their way to the scene. When they arrive, additional water will pour forth from their hoses, in the guise of government spending, to put the flames completely out. Whether in China, Italy, The United States, India, or elsewhere, governments around the world continue to put fiscal constraints aside to ensure economic growth continues, putting off the day of reckoning for the Global Economy and leaving the price of this spending to be paid at some indeterminant point in the future.
To date, over 20 Central Banks around the world, including those in the US, Europe, Brazil, Australia, China, Chile, Malaysia, Peru, New Zealand, and elsewhere have lowered interest rates by 25 or 50 basis points recently or indicated they plan to do so. And with the Global Consumer continuing to spend and, as a result, the Global Inventory Cycle headed to a bottom, the lagged impact of these actions should see Global Growth start to reaccelerate before year end. When these actions are coupled with the additional fiscal spending authorized over the past year in major economies, like the US, EU, Japan, and China, and the additional spending proposed or authorized recently, Global Growth should recover much more quickly than expected in 2020. Should the data continue to validate this scenario, the world will enter another period that looks like 1967 – 1969 and 1998 – 2000 with all the pluses and minuses these periods produced.
Dragon Recessions
For China, the word “Recession” does not exist, regardless of the story the data tell. If a description of an economy included auto sales down 14%, TV sales down 7%, exports down, rising bank failures, increasing government stimulus, and central bank interest rate cuts, the normal conclusion would indicate that the economy stood in Recession. However, for China, such a state of affairs produces a stated GDP Growth of 6.2%. This level of GDP Growth stands consistent with the pronouncements from the central government indicating year ahead growth and with the goals of the Communist Party’s latest 5 Year Plan. For China, while the rest of the world struggles with growth and all the variability that can occur, growth continues here at a predicted pace.
For those wondering how such a state of affairs can exist, a breakdown of China’s economy demonstrates how the government can produce growth numbers despite what would produce a contraction in any other economy. China breaks its economic growth into Fixed Asset Investment (FAI), industrial growth, services, and government. Industry makes up ~40%+ of its economy. According to the latest statistics issued by the government, its Industrial Production (IP) grew at over 6.3% for the first half. Services/ retail spending, which make up 40%+ of the economy, continue to grow rapidly, at over an 8% rate. And lastly, Government spending on infrastructure coupled with State Owned Enterprise (SOE) capital investment, which drives FAI and which makes up the remaining portion of the economy, continues to grow with FAI Growing at almost 6% (5.8% officially reported) from January to June. Private Investment grew 5.7% and Public Investment grew 6.9%. When put together, it is easy to see how this Command and Control Economy could produce 6% stated growth despite a significant global growth deceleration.
However, some interesting facts emerge when viewing these growth statistics in context. China’s Industrial Production, according to IMF data, stands at more than $10 trillion on a PPP basis (Purchasing Power Parity), an amount larger than Europe and the United States combined. Despite an industrial slowdown globally and a domestic drop in auto and TV consumption, China did not show a slowdown in the growth rate of its Industrial Production. And somehow, its exports grew at a 21%+ annual rate over the past three months at the same time as its imports contracted. This allowed its Net Exports to contribute 1.3% points of the 6.3% reported for year over year Q2 GDP Growth. In addition, despite global steel production dropping outside of China in the first half of 2019, reflecting the global inventory correction and manufacturing slowdown, according to data from the World Steel Organization, China increased its production by 10%. Entering 2019, China produced 51% of global steel. With its steel exports slowly but surely being systematically shut out of other countries, one might ask where China could use the incremental 12% to 15% of steel production internally with FAI spending up 6% or less. (For example, Iran will increase its steel production from 25 million tons in the year ended March, 2019 to over 30 million tons in the year ended March, 2020.) And if one states real estate investment, real estate already comprises 15% of GDP. And while Square Footage Started is up a little over 7% in H1, sales of real estate square footage are up just 2% year over year. And the cost of a typical apartment is 40x the average Chinese urban income in cities such as Beijing, Shenzhen, and Shanghai. Yet, according to the official statistics, real estate investment grew 10.9% in real terms in the first half. On the personal side of the equation, a real slowdown is unfolding. Hilton Hotels indicated it now expects REVPAR Growth (Revenue Per Available Room) to be flat in 2019 compared to 6% to 9% entering the year. Other data provide a similar picture. To the members of the Politburo, who see the real data, this growing evidence of a slowdown must be clear. Chinese Government Bond Issuance exploded in H1. It grew well over 100% year over year in Q1 and almost 20% in Q2. With the relaxation of the issuance of Local Government Bonds for use as Equity in Infrastructure projects by the Central Government recently, this issuance should reaccelerate in H2. As a result, China’s Debt to GDP Ratio is forecast to rise 8 – 10 points this year. Non-Financial Sector Debt to GDP already stood over 250% of GDP entering 2019 and, at this rate, China will exceed 300% before 2025. So, while China can grow at 6.2% exhibiting its unique blend of Dragon Recession, the long term sustainability of such policies stands in question.
A Setting Sun
Japan continues to struggle with economic growth. Year over year GDP Growth fell to 0% in Q2, with the country narrowly avoiding a recession. This followed a rousing 0.9% GDP report for Q1. Overall Machinery Orders stand where they stood in early 2015 despite over 4 years of time passing. Reflecting this lack of growth, Japanese Industrial Production looks like an oddly shaped pancake from Q2 2017 to today. This reflects a flattening out in exports since early 2017. With a VAT hike coming in October, when the VAT Rate will rise from 8% to 10%, consumption likely will come under pressure later this year. And despite the normal rush to buy goods prior to a VAT Hike, there exists no evidence Japanese consumers opened their wallets ahead of time. And despite a budget deficit of 7.5% of GDP and a Government Debt to GDP Ratio of over 200%, the Japanese government talks openly of increasing spending to offset the expected hit to the economy from the VAT hike. In fact Prime Minister Abe publicly indicated that the government would spend significant monies to offset this tax increase. However, this will do little to address the looming structural issues facing Japanese growth. First, as China builds out its technology industries as well as high value industrial goods production, Japan will find its exports to China replaced by Chinese domestic production. Second, with the United States looking to reclaim its industrial production in areas such as autos, robotics, and industrial equipment, Japan’s large trade surplus with the United States likely will come under pressure. While Japan can continue to stimulate its economy, using the Bank of Japan to monetize its debt, this will not solve the fundamental growth equation facing its economy as it faces A Setting Sun.
Elephant Wanderings
In contrast to Japan, India stands in the early stages of Developing Economy growth. As it builds out the fundamental building blocks of its economy, economic growth should sustain at a reasonable rate for the foreseeable future. Consumption growth has accelerated with volumes of consumer goods such as paints, toothpaste, and spirits rising at over an 8% rate so far this year compared to less than 6% for the last few years. However, India does not stand immune from the global slowdown. Real Gross Fixed Capital Formation slowed from 12.2% year over year in Q4 2017 to just 3.6% in Q1 2019. Industrial Production growth ran at less than 3.5% year over year recently. In addition, the country possesses a rickety structure for a financial system, similar to the issues that the United States faced in the 1800s. Non-Bank Financial Companies (NBFCs) make up over 40% of its financial system. With the recent bankruptcy of a prominent NBFC, credit for areas such as auto sales became very tight. In fact, auto sales dropped 10% year over year at some points during Q2 as consumers could not get the loans to continue to purchase these vehicles. To offset this issue, the government entered into a 1 trillion Rupee stimulus program, equivalent to 0.7% of India’s GDP. In addition, the government put pressure on the central bank to ease. Recent data indicate this may be having some salutary effects as two wheeler vehicle sales appear to be bottoming. While the worst may be over for the industrial side of the economy, the agricultural side faces significant potential stress. The Monsoon stands 17% below normal, according to the latest data. With 70% of India’s population rural, this could portend some real issues later this year. For these rural consumers, food represents 50% of their spending. Any spike in food costs could significantly impact them. And even for urban consumers, food makes up 35% of their spending. So, with Elephant Wanderings due to the cross currents in the economy, developments in the Monsoon need close attention.
Tiger Feast
For Southeast Asia, the move away from China as a production hub for global industry stands as a boon that will help to sustain their fundamental economic growth. These countries appear well positioned to gain manufacturing production at the expense of China. For example, Vietnam’s GDP grew ~7% in the first half of the year, as the economy continues to benefit from Foreign Direct Investment (FDI). Reflecting this FDI surge, July IP grew 9.7% year over year and its exports surged in the first half. Other countries in the region expected to benefit from this shift in production include the following: The Philippines expected to grow at almost 6%, Indonesia expected to deliver 5%+ growth, and Malaysia which should grow at 4.5% or better this year. The issue for these economies stands some few years in the future as the global trading system returns to the GATT. In the meantime, these countries will enjoy a Tiger Feast.
Samba Anyone
For Brazil, the on the ground data suggest the economy continues to recover. This contrasts to the official statistics for GDP and industrial production which indicate an economy vacillating between growth and shrinkage. For example, core retail sales turned consistently positive on a year over year basis over the past few months. The Brazilian statistics office reported Q2 Broad Retail Sales growth at almost 4% year over year. This correlates with data published by hypermarket companies and wireless telecom companies indicating consistent growth in their businesses in Brazil. Truck sales recently grew over 30% year over year. Auto sales rose 11% year over year in July. Tractor sales are expected to grow strongly in the second half as the government restores the key loan program, FINAME, that was interrupted in the first half and farmers make up for postponed purchases of equipment. For the farmer, the agricultural sector continues to benefit from the significant depreciation of the currency as well as production problems around the world. Production exhibits no issues in Brazil. Soybean production should reach a new all time high and corn production will grow significantly. (See the latest WASDE report available at https://www.usda.gov/oce/commodity/wasde/ ) Combined, these should produce record farm profits. In addition to these positive data points, the government continues to enact pro-business policies that should encourage significant investment over time. In response to these actions, the Brazilian stock market exploded to the upside. With many positives going for it, economic data should start to reflect this underlying reality and see the ordinary Brazilian saying Samba Anyone.
The Old Man’s Struggles
While the Emerging Economies possess fundamental drivers to their economies, Western Europe possesses a fundamental impediment, called the Euro. The Euro, combined with the decisions of the European Central Bank (ECB) on monetary policy, can not serve the interests of multiple countries who need differing monetary policies, fiscal policies, and currency policies. And it is this fundamental contradiction that stands in the way of European growth. The biggest loser in the past 20 year experiment is Italy. In 1999, prior to giving up the Lira for the Euro, Italian Industrial Production stood above that of Germany. Today, it stands over 20% below. The country endured the worst stretch of growth since the Great Depression over the past decade. And recent growth is nothing to write home about as Italian GDP grew at a rate of less than 1% in this year’s first half. In addition, somehow, the EU blessed France’s budget, which possesses a higher structural deficit than Italy, but told Italy to cut its spending. For those who wonder why the populist parties continue to rise in the polls in the boot, the answer is simple. The European Union (EU) cannot serve multiple masters. And the masters that have feasted at the table are Germany and the northern European countries.
For Germany, the benefits of the EU stand clear. With 40% of its economy export oriented, the Euro’s value in the global currency markets stands well below where the German Mark on its own would stand. Thus, the undervaluation aided Germany’s growth. Unfortunately for Germany, those who live by the sword, die by the sword. With China’s economy maturing and needing to grow differently than over the past 20 years, the demand for German capital goods already has begun to wane. Furthermore, moves by the ECB to loosen monetary policy and lower the value of the Euro against the US Dollar now meet resistance. The current U.S. Administration understands fair value for the Euro stands 20%+ above its current valuation. And with currency depreciation off the table, Germany must compete with other countries in the Eurozone, such as Spain, which possess lower manufacturing costs. Lastly, with the UK leaving the Eurozone, other countries will consider similar actions. The obvious next candidate is Italy. Should Italy recreate the Lira, and the creation of the BOT sounds awfully close to the Lira, the country likely would massively depreciate its value to restore its global competitiveness, leaving Germany with a less competitive position and recapturing the lost 20 years of Industrial Production at Germany’s expense.
For Central Europe, such a breakup will cause significant indigestion. These countries currently benefit from a transfer of monies from the mature countries in the EU that goes directly into investment to build infrastructure and manufacturing plants. This transfer contributes a not insignificant 1.5% to GDP growth per year for these countries. Should Pooh Bear, Central Europe in this case, find the honeypot empty, he would go hungry for quite some time. In addition, Central European countries, such as the Czech Republic and Hungary, supply significant amounts of auto parts to Germany’s auto manufacturers. Should the Euro revalue upward to fair value against the US Dollar or should Germany find itself needing to recreate the Deutsche Mark, a hard currency, then the competitiveness of German exports could significantly deteriorate, with the expected economic impact on Central Europe. With the Old Man’s Struggles coming to the fore, it seems just a matter of time until the economic structure holding the EU together collapses under its own weight.
The Climb To The Top
For the United States, the Federal Reserve finally relented in its tightening campaign. Late is better than never, sometimes. With a Yield Curve threatening to invert, the Federal Reserve finally lowered rates by 25 basis points, 0.25%, in order to forestall such an occurrence. However, with Chairman Powell indicating the Federal Reserve would not follow-up with additional cuts and indicating that this cut was begrudgingly given, the Yield Curve actually flattened, as the following chart demonstrates:
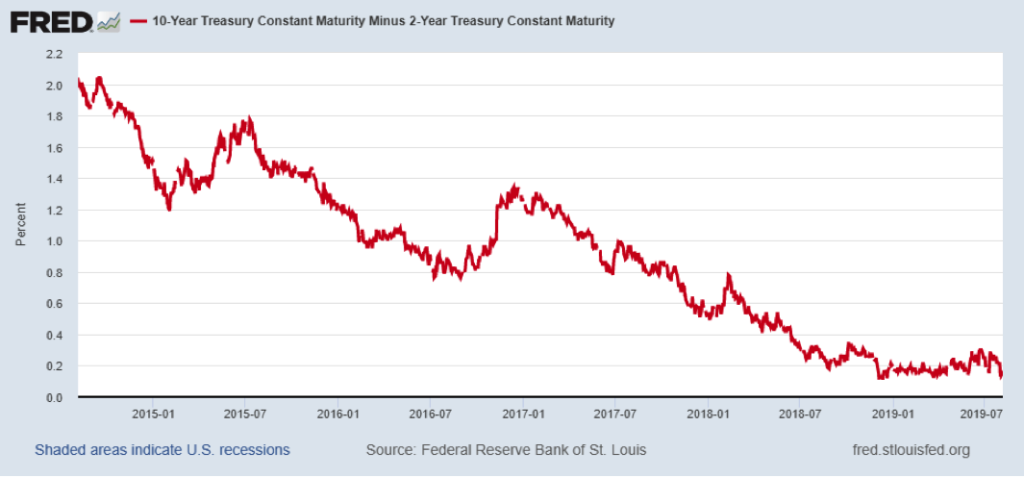
For the economy, this was not what the doctor ordered. It indicated serious issues with the economy that the Federal Reserve seemed to be missing, for the Yield Curve does not flatten in a vacuum. And this version of the Yield Curve tends to give a long lead signal on growth ahead.
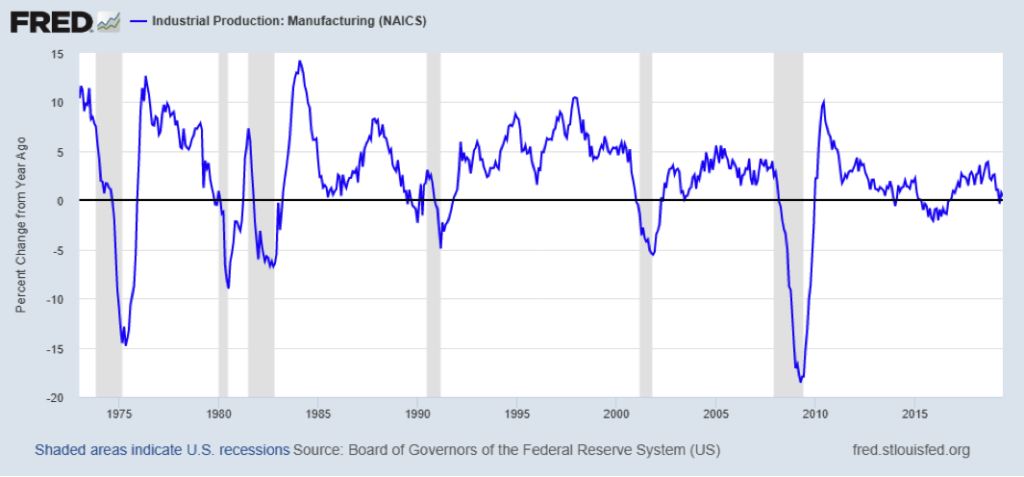
Recent economic data fully justify the continued flattening in the bond markets, despite the Federal Reserve’s statements to the contrary. First up is the PMI. With the ISM’s PMI (Purchasing Manger Index) hovering near 50, a potential contraction in the manufacturing economy lies ahead as the global inventory correction rolls onward. This can already be seen in Industrial Production (IP) growth which now hovers around the zero line:
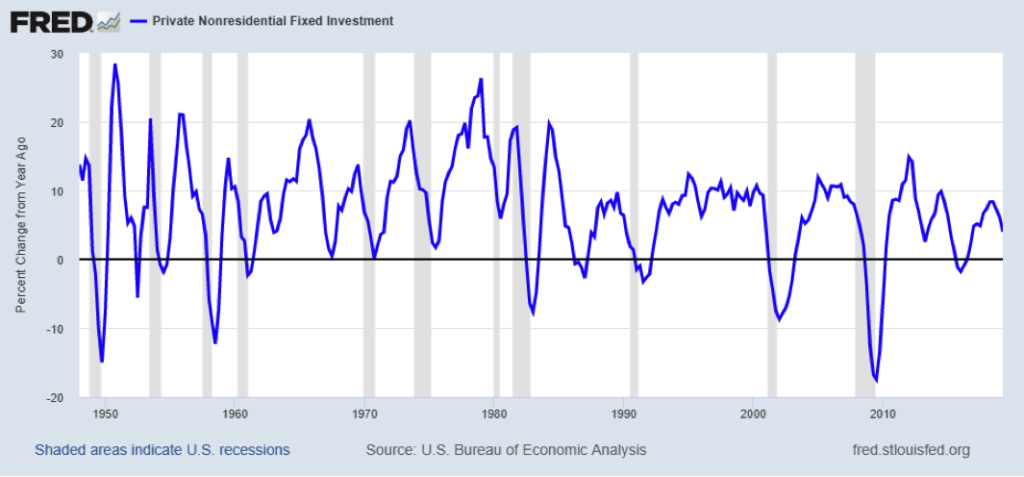
And, as would be expected, if there is no growth in IP, then Investment growth slows down. The following chart of Non-Residential Fixed Investment Growth clearly demonstrates this:
And should one examine the residential side of the economy, it looks no better:
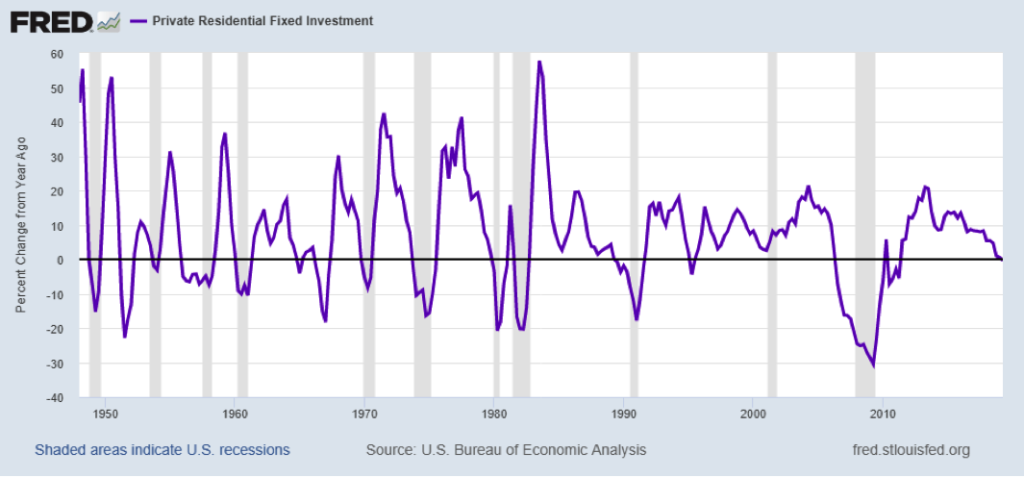
While it is difficult to tell from this chart, due to the scale, Private Residential Fixed Investment turned slightly negative on a year over year basis recently. This downturn originates in the Single Family sector, which clearly rolled over last year and is now dragging the total down:
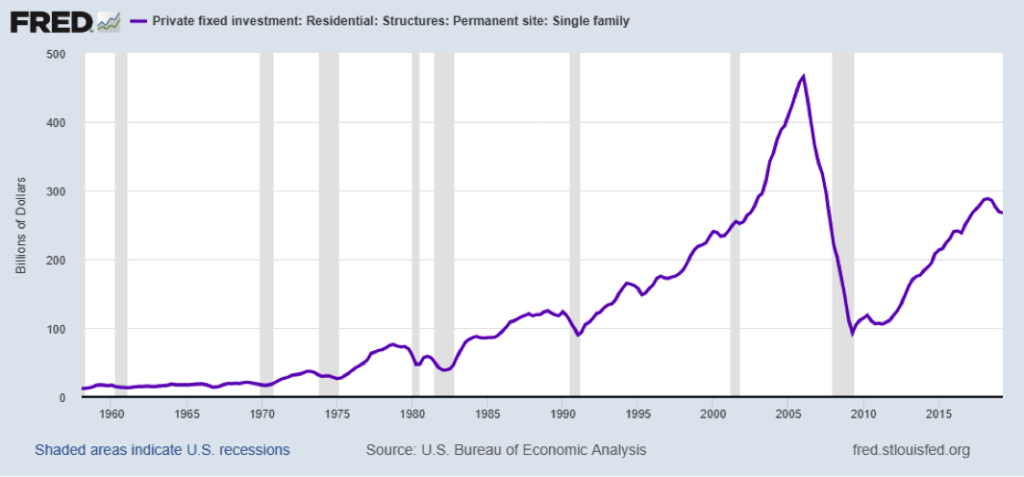
And while multi-family continues to grow, its’ growth is slowing.
There exist only two areas keeping the U.S. economy growing. First, the consumer continues to spend:

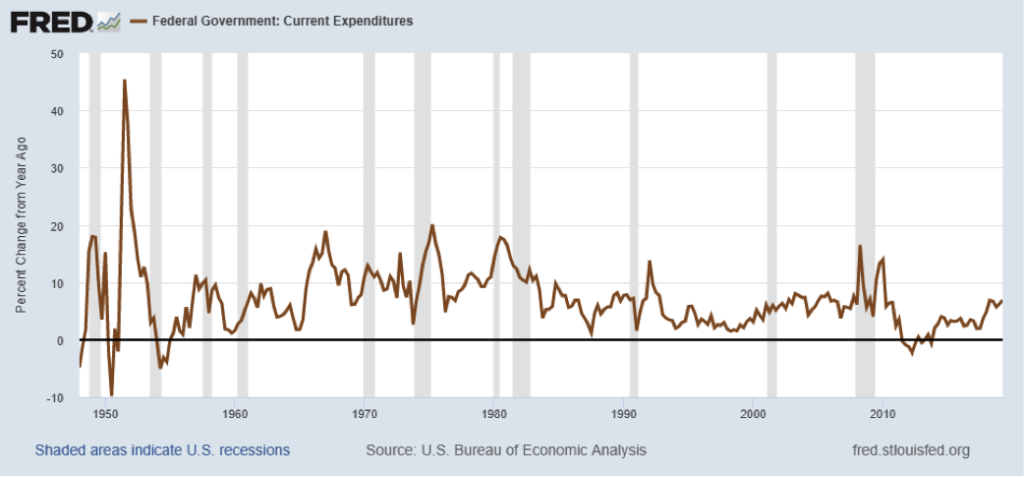
Though, as the chart makes clear, consumer spending growth appears slower than over the recent past. And second, the government continues to spend. Both the federal government:
And the states:

However, there lie significant risks with these two remaining drivers. First, consumer spending depends on continued job growth and income growth. Job growth slowed significantly over the past year. And the leading indicators for it appear to have stalled out. This is most easily seen in Small Business Optimism, which is tracked by the NFIB (National Federation of Independent Business):
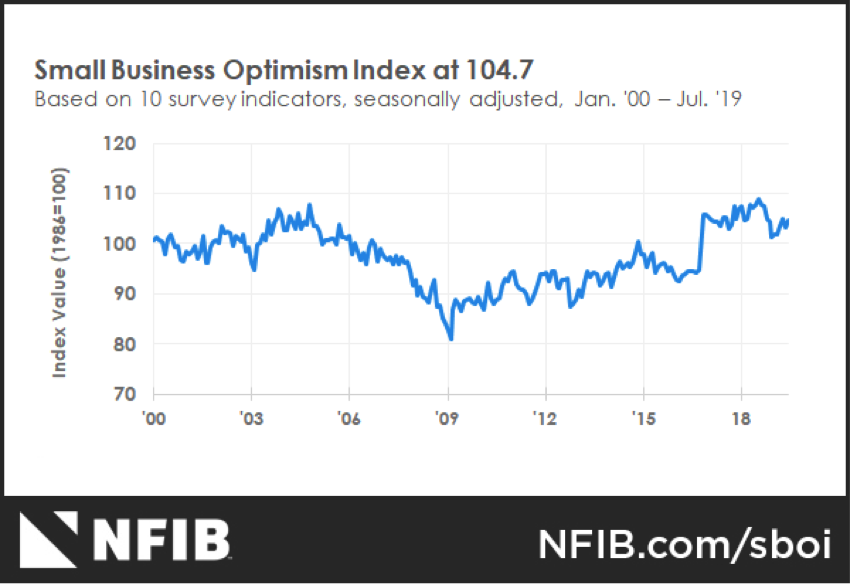
As the chart above indicates, Small Business Optimism pulled back in a similar fashion to 2005. This long lead indicator typically starts to deteriorate 2 years prior to a recession. And it feeds back into hiring, as small businesses contribute a disproportionate share of the growth in workers.
In addition, State and Local Spending exhibits highly pro-cyclical movements. In other words, when the economy grows, so do taxes. Therefore, states and municipalities spend more. When taxes slow down growth or shrink, states and municipalities must slow their spending growth or actually cut spending. This is due to the fiscal regime under which states operate. Unlike the Federal Government, states possess balanced budget requirements. Thus, when the revenue does not appear, either taxes rise or spending gets cut or both. Either impacts economic growth negatively.
For the U.S., the economy can now see the peak as the long leading indicators indicate downturn ahead. But, they do not indicate an imminent downturn. With the Global Inventory Cycle headed towards bottom in H2 2019 and Global Central Banks easing aggressively, one more reacceleration likely lies ahead. And as the U.S. economy likely picks up steam in 2020, as global growth reaccelerates, it truly will be The Climb To The Top. (Data from The Federal Reserve, U.S. Census Bureau, Foreign Government Releases, and company data coupled with Green Drake Advisors analysis.)
Confidential – Do not copy or distribute. The information herein is being provided in confidence and may not be reproduced or further disseminated without Green Drake Advisors, LLC’s express written permission. This document is for informational purposes only and does not constitute an offer to sell or solicitation of an offer to buy securities or investment services. The information presented above is presented in summary form and is therefore subject to numerous qualifications and further explanation. More complete information regarding the investment products and services described herein may be found in the firm’s Form ADV or by contacting Green Drake Advisors, LLC directly. The information contained in this document is the most recent available to Green Drake Advisors, LLC. However, all of the information herein is subject to change without notice. ©2019 by Green Drake Advisors, LLC. All Rights Reserved. This document is the property of Green Drake Advisors, LLC and may not be disclosed, distributed, or reproduced without the express written permission of Green Drake Advisors, LLC.