Shades of 1999: Initial Public Offerings or Indications of the Public’s Optimism?

“Sell in May and go away.”
Old Wall Street Saying
Despite the market rebounding over 30% since December 24 to reach its prior high, the market essentially stands exactly where it stood in January 2018. So, besides collecting dividends, the average investor, who now invests in index funds, would have received a 0% return on his holding of stocks. With a Dividend Yield of ~2.0% on the S&P 500, the average investor would have done better buying 1 Year Treasury Bills yielding between 1.95% and 2.73% or a midpoint of 2.35%. This should come as no surprise given the late cycle nature of the US economy as well as the starting valuation on the Equity Markets. The Shiller PE shows just how expensive the market remains on a long term basis:
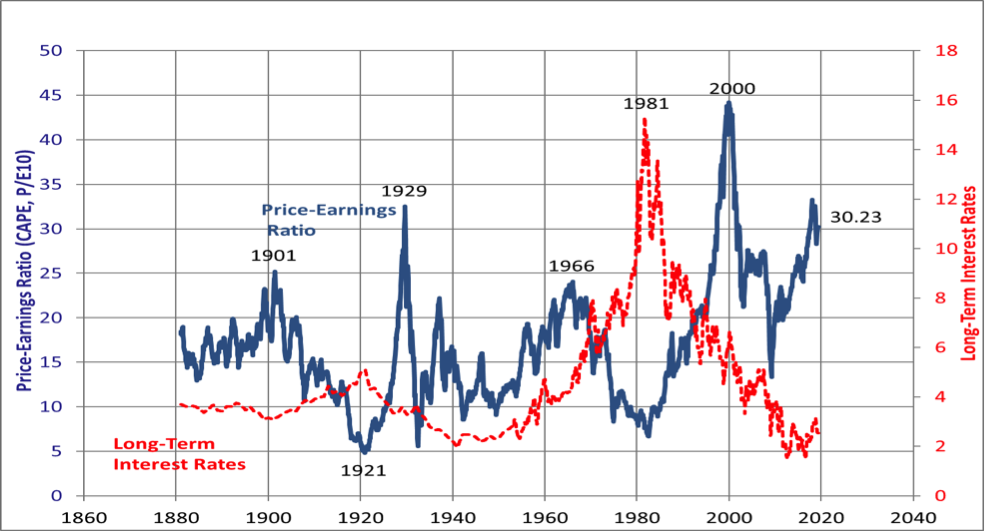
Chart courtesy of Robert Shiller, Yale University.
While one cannot use this tool as a short term timing tool, this valuation, along with that indicated by equity ownership and market capitalization to GDP, indicates that long term returns from the Equity Markets will produce muted results for most investors, at best.
To understand why valuations stand where they do, two simple factors continue to play an undue influence. First, Central Banks around the world flooded the world with cheap money and manipulated long term interest rates downward. This drove the discount rate on the market down. In other words, instead of discounting a company’s cash flow at 5% or 6%, the market is discounting these same cash flows at 3% or 4%. This justified a higher valuation on the market. Second, company operating margins have soared, leading to profit growth well in excess of revenue growth over the past decade.
There is a curious fact connected to this miraculous rise. EBITDA margins have gone nowhere over the past 30 years. (EBITDA stands for Earnings Before Interest, Taxes, Depreciation, and Amortization.) In other words, corporate cash flow relative to revenue remains the same. Corporate margins soared as companies stopped reinvesting in their businesses, moving to a “Capital Light” model. Instead, they outsourced the production of products and the associated investment to companies in other countries and became assemblers of products. This allowed them to significantly decrease investment and not have to bear the associated depreciation of those assets. (This action also directly impacted U.S. Productivity Growth in a negative manner as overall Investment to GDP fell.)
However, with a change in Administration, it appears these factors have begun to reverse. First, U.S. Productivity Growth now stands over 2%. As a result, the U.S. appears headed for faster long term growth which likely will lead to higher interest rates, increasing the Discount Rate on the market and lowering valuation. Second, the U.S. government determined that domestic production stands as a priority. Thus, companies will need to build more product in the United States, forcing them to increase investment. Recent data support this move toward higher levels of investment. Capital Expenditures rose 12% year over year in Q4. In addition, according to the Census Bureau, manufacturing investment turned positive in 2018 and continues to grow in 2019. As this second factor slowly but surely reverses, leading to less free cash flow and more depreciation once again, the miraculous growth in operating margins will reverse leading to an equally “miraculous” contraction in operating margins over time. (Public Company managements might not agree with this last comment.)
With numerous private companies looking at this scenario, companies with little or no profits have started to come to the public markets to take advantage of the current valuations, much as occurred in the late 1990s. While companies such as Uber and Lyft stand as the most visible corporations to come public, numerous other companies that have joined them include Zoom, Pinterest, Fastly, Avantor, Luckin Coffee, and Beyond Meat. Waiting in the wings for their turn in the sunlight are Slack, Crowdstrike, Airbnb, Palantir, and WeWork as well as numerous other companies. Despite their valuations, most of these IPOs (Initial Public Offerings) have soared since their public debut. Zoom stands 150% above its IPO price while Beyond Meat rose from $25 at its IPO pricing to over $90, a greater than 250% increase. With this type of IPO performance, speculative juices appear to be running rampant on Wall Street. The last time such a wave of companies hit the markets in 1999 and 2000, they soared as investors could not get enough of their stocks. However, by 2003, valuations collapsed for companies with true business models that came along with profits, while a significant number of the hot IPOs, that could not produce profits, went out of business, making their stock certificates useful as wallpaper. While it is too early to make such a call, the hot IPO market, as in the past, reflects the high valuations in the public markets, as the markets have moved from “Fear” in early 2009 to “Greed” today. Unfortunately, the history of such periods usually ends with a large hangover once the Federal Reserve declares an end to the party.
With valuations high and IPOs soaring, the market stands in the 8th or 9th inning of the ballgame. While significant money can be made, the risk level continues to rise. History would indicate such periods are cyclical and do not last long. Investors merely need to look at the history of the late 1980s and late 1990s. However, the party is going strong and who wants to miss out on the next hot IPO. With such Indications of Public Optimism, investors must keep a close eye on the exit, as the Federal Reserve will call the end to the game. (Data from public sources and Robert Shiller coupled with Green Drake Advisors analysis.)
Confidential – Do not copy or distribute. The information herein is being provided in confidence and may not be reproduced or further disseminated without Green Drake Advisors, LLC’s express written permission. This document is for informational purposes only and does not constitute an offer to sell or solicitation of an offer to buy securities or investment services. The information presented above is presented in summary form and is therefore subject to numerous qualifications and further explanation. More complete information regarding the investment products and services described herein may be found in the firm’s Form ADV or by contacting Green Drake Advisors, LLC directly. The information contained in this document is the most recent available to Green Drake Advisors, LLC. However, all of the information herein is subject to change without notice. ©2019 by Green Drake Advisors, LLC. All Rights Reserved. This document is the property of Green Drake Advisors, LLC and may not be disclosed, distributed, or reproduced without the express written permission of Green Drake Advisors, LLC.