Productivity And The Long Term: The Pathway to Higher Sustainable U.S. Growth

“Manufacturers, those of the finder kind especially, are more easily transported from one country to another than corn or cattle. It is in the fetching and carrying manufacturers, accordingly, that foreign trade is chiefly employed. In manufacturers, a very small advantage will enable foreigners to undersell our own workmen, even in the home market. It will require a very great one to enable them to do so in the rude produce of the soil. If the free importation of foreign manufactures were permitted, several of the home manufactures would probably suffer, and some of them, perhaps, go to ruin altogether, and a considerable part of the stock and industry at present employed in them, would be forced to find out some other employment. But the freest importation of the rude produce of the soil could have no such effect upon the agriculture of the country.”
Of Restraints Upon The Importation From Foreign Countries of Such Goods
As Can Be Produced At Home
Book IV: Of Systems Of Political Economy
The Wealth of Nations
By Adam Smith, 1776
Despite the endless negative narrative indicating the US will never grow again, recent data indicate the US once more could grow at its long term norm of 3% – 4%. The long term growth rate stemmed from basic fundamental factors that underpinned the economy. These fundamental factors enabled the U.S. to average this type of economic growth over every 5 Year and 10 Year period since World War II, except for the time from 2011 – 2016. While numerous skeptics remain of this possibility, including much of the media and Wall Street, there exists a clear path to achieve this outcome. This path includes a focus on Investment into the US and on ensuring the US produces more of the goods it consumes. Despite the noise from those who would find this inconvenient to their point of view, there exists a long line of economic research linking Manufacturing growth to Capital Spending to Productivity. Economists, whether on the right or the left, agree that Productivity stands as the linchpin of long term, economic growth and that Productivity plus Population Growth produce growth with reasonable inflation. Thus, should the US create Productivity Growth of 2%+ and grow its population 1%+, then long term economic growth could return to 3% – 4%, where it stood prior to 2011.
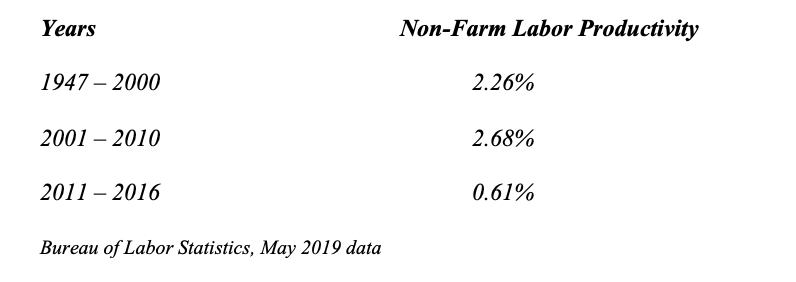
During the period from 2011 – 2016, Productivity Growth proved close to non-existent. It only averaged only 0.6%. With Population Growth of 1% or less, the press, the Federal Reserve, and even the Congressional Budget Office decided that US sustainable growth could not exceed 1.8% over the long term without causing massive inflation. Somehow, they threw out the prior 60+ years of economic growth and the data associated with it for a period of 6 years of data, as the following table shows:
No one considered that there could exist a simple explanation to the lower Productivity Growth for this six year time period. It came down to the collapse in US Capital Formation. The following graph shows this collapse in the last recession and the poor recovery since then:
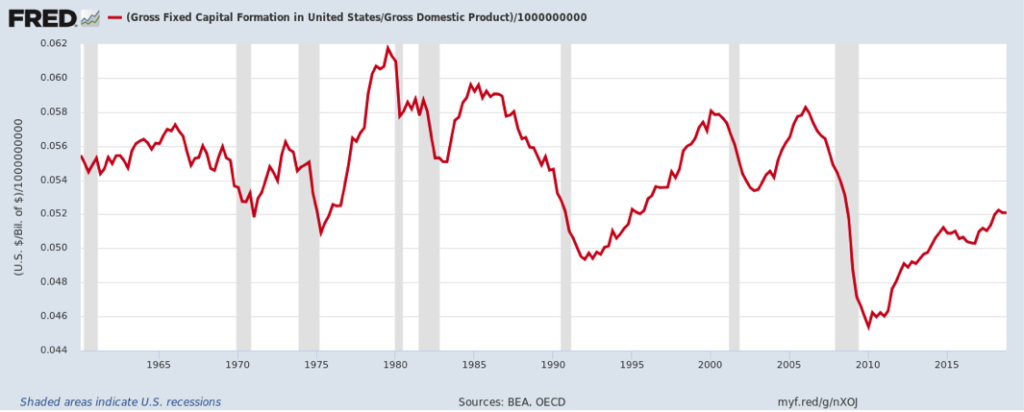
So, for the economic expansion from 2011 – 2016, US Capital Formation relative to GDP remained below the lows of most prior recessions since 1960. In other words, in plain English, the country suffered from a lack of Manufacturing Growth which led to a lack of Investment. And Productivity Growth, to no one’s surprise, collapsed, as every economic model would indicate.
However, there appears light at the end of the tunnel. It appears that Capital Formation relative to GDP is beginning to recover, in a similar manner to the way the recovery played out from the inflationary 1970s. Recent government data on Productivity Growth bear this out as the following table demonstrates for Year Over Year Productivity Growth:
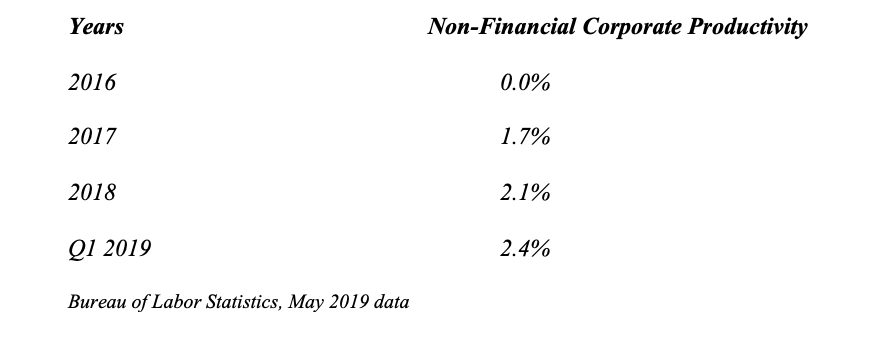
As the data demonstrate, it appears the US is headed in the correct direction. And such a change would make intuitive sense. With labor costs rising once more, there exists incentive for business to invest. And with the US beginning to protect its domestic manufacturers from subsidized and protected manufacturing overseas, there exists further incentive to invest.
There exist two more levers that have yet to come into play. With a rising global economic and strategic rival, national security likely will come to dominate technology and manufacturing discussions. The US remains an R&D powerhouse, as the following chart demonstrates:
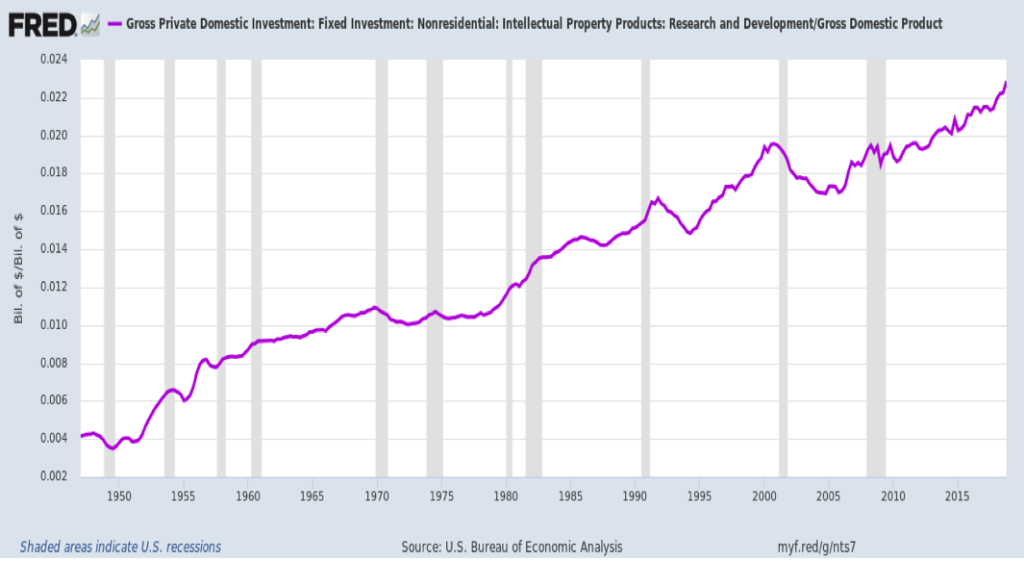
Should the U.S. choose to require that this technology remain in plants and other facilities domestically, then it would provide the basis for significant Investment. For example, the US allowed Lucent, the telecom equipment arm of AT&T, that was spun off as a public company, to be purchased by Alcatel, the French telecom equipment company. The combined enterprise then was purchased by Nokia, the Swedish telecom equipment company. If one wonders why there is no US company to manufacture 5G telecom equipment, this answers the question. This lack of domestic capability now stands as a national security issue. New technologies, such as 3D Additive Manufacturing, will become key to global competitiveness. Should the US require this technology and others under development to remain in US plants, it could change the balance of global cost competitiveness for the US, encouraging significant Investment into the country’s domestic manufacturing capacity.
The last lever for the government to pull will shake global markets. For to address this lever will put the global economic model followed by a number of countries at risk. This lever relates to currencies. Numerous Emerging Market economies depreciate their currencies to maintain or create global competitive advantage. For US manufacturers, it becomes difficult to compete when your competitors can get their governments to lower their costs by 30% without spending an additional dollar on capital. The following chart illustrates this issue:
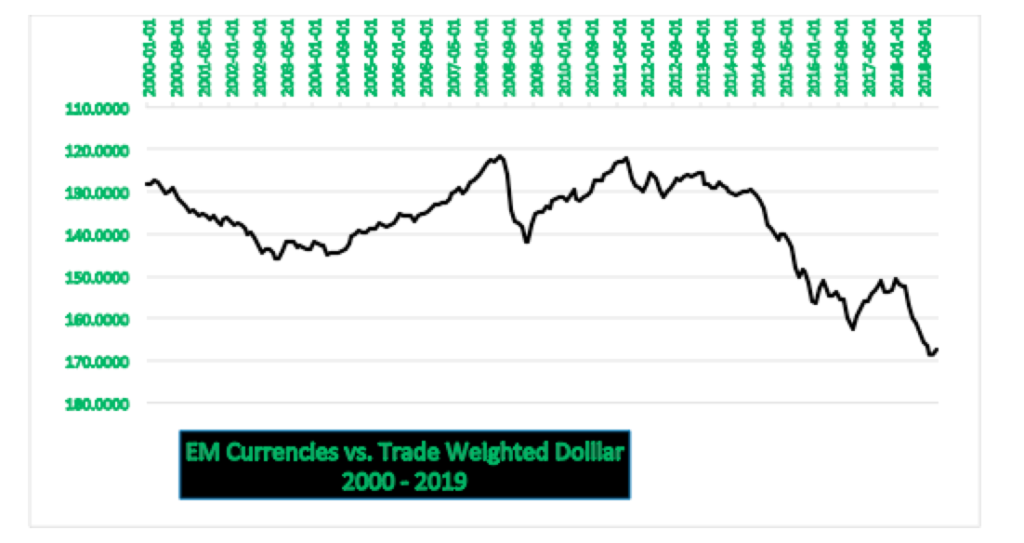
From 2013 – 2018, Emerging Market economies depreciated their currencies collectively over 30% against the US Dollar, on a trade weighted basis. Not only does this impact manufactured goods production, but it impacts other aspects of the economy, such as farming, chemical production, pharmaceutical production, mining, computer services, … In other words, it creates a well-known drag on US growth. In fact, there exist numerous econometric models that lay this out in great detail. These models collectively show an approximate 1% drag in the subsequent year and another 0.5% drag the year after, on average, for every 10% decrease in the value of foreign currencies against the US Dollar. So, the 30%+ drop in these EM currencies created a 1.5%+ per annum drag on the US economy over the past few years. Looking at reported GDP, based on the latest government data from April, 2019, as published by the US Bureau of Economic Analysis, would show the following:
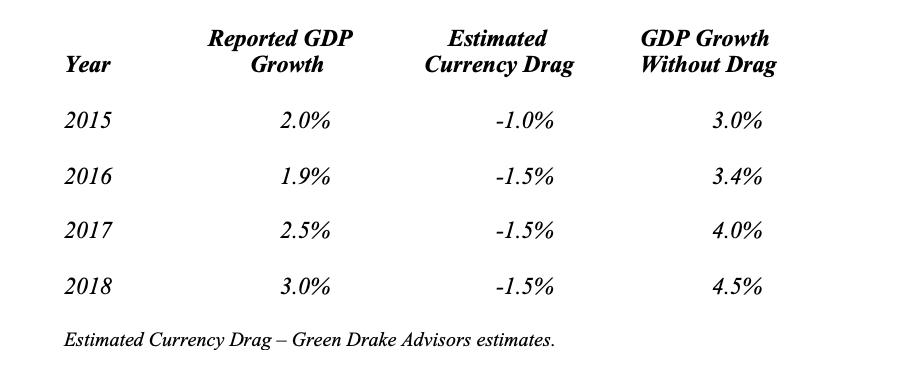
While these numbers stand as approximations, they represent directionally the amount of US GDP transferred to the rest of the world each year for the past 4 Years. With the US now in a contest with China for global economic dominance, the US national interest will dictate that the US reclaim a significant portion of this “leakage” and move to prevent such outcomes in the future. With the U.S. Dollar significantly overvalued compared to Emerging Market currencies, any correction in this imbalance will send shockwaves across the globe, causing anything from a minor tremor to a 9.5 Richter Scale earthquake, depending on the economy.
As the above data demonstrate, the period from 2011 to 2016 appears the anomaly, not the new norm. With the U.S. now producing less than 50% of the goods it consumes, there exists significant runway to reclaim goods production for domestic consumption. Furthermore, should the U.S. return to a Cold War mentality that restricts the export of technology to other countries, this newly developed technology, underpinned by heavy domestic R&D spending, would find itself applied in U.S. plants, boosting the country’s competitiveness globally and enabling the country to compete effectively in new and older industries. Lastly, should the U.S. government confront the manipulation and undervaluation of Emerging Market currencies, a significant drag on U.S. growth would disappear, enabling the country to recapture the growth shifted overseas through this mechanism. While the United States began to address these issues over the past two years, there exists significant runway ahead as the government begins to put a coherent plan in place that utilizes all the levers at its disposal. And with higher Productivity Growth the benefit of all these policies, the Pathway to Sustainable Higher U.S. Growth lies ahead. (Data from U.S. Bureau of Economic Analysis, U.S. Bureau of Labor Statistics, and the Federal Reserve Economic Database coupled with Green Drake Advisors analysis.)
Down on the Farm, Not a Smartphone, Soylent Green, and A Makr Shakr in Every House
Finally, we close with brief comments on Down on the Farm, Not a Smartphone, Soylent Green, and the Makr Shakr. First, Corn plantings are way behind schedule. Corn is only 49% planted compared to the norm of 80% at this time of year. For US producers, it is Down on the Farm. Second, according to industry data, global smartphone sales fell in Q1 by 6% year over year. With most consumers already possessing their own, we see them saying: Not a Smartphone. Third, companies such as Beyond Meat have recently hit the market. The company, as well as its competitors, produce lab grown meat, no animals involved. With this rapidly coming to market, we see the world of Soylent Green fast approaching. And Fourth, for those tired of mixing their own drinks there is a solution. You can now buy a robot to do it for you. Straight from Torino, Italy comes a full blown robotic bar system. With technology advancing, it won’t be long before we hear the following: A Makr Shakr in Every House.
Confidential – Do not copy or distribute. The information herein is being provided in confidence and may not be reproduced or further disseminated without Green Drake Advisors, LLC’s express written permission. This document is for informational purposes only and does not constitute an offer to sell or solicitation of an offer to buy securities or investment services. The information presented above is presented in summary form and is therefore subject to numerous qualifications and further explanation. More complete information regarding the investment products and services described herein may be found in the firm’s Form ADV or by contacting Green Drake Advisors, LLC directly. The information contained in this document is the most recent available to Green Drake Advisors, LLC. However, all of the information herein is subject to change without notice. ©2019 by Green Drake Advisors, LLC. All Rights Reserved. This document is the property of Green Drake Advisors, LLC and may not be disclosed, distributed, or reproduced without the express written permission of Green Drake Advisors, LLC.