The Equity Markets: A Visit to the 1990s and A 1960s Springtime At The Bourses

“Every great crisis reveals the excessive speculations of many houses which no one before suspected, and which commonly indeed had not begun or had not carried very far those speculations, till they were tempted by the daily rise of price and the surrounding fever. The case is worse, because at most periods of great commercial excitement there is some mixture of the older and simpler kind of investing mania. Though the money of saving persons is in the hands of banks, and though, by offering interest, banks retain the command of much of it, yet they do not retain the command of the whole, or anything near the whole; all of it can be used, and much of it is used, by its owners. They speculate with it in bubble companies and in worthless shares, just as they did in the time of the South Sea mania, when there were no banks, and as they would again in England supposing that banks ceased to exist. The mania of 1825 and the mania of 1866 were striking examples of this; in their case to a great extent, as in most similar modern periods to a less extent, the delirium of ancient gambling co-operated with the milder madness of modern overtrading. At the very beginning of the adversity, the counters in the gambling mania, the shares in the companies created to feed the mania, are discovered to be worthless; down they all go, and with them much of credit.
The good times too of high prices almost always engender much fraud. All people are most credulous when they are most happy; and when much money has just been made, when some people are really making it, when most people think they are making it, there is a happy opportunity for ingenious mendacity. Almost everything will be believed for a little while, and long before discovery the worst and most adroit deceivers are geographically or legally beyond the reach of punishment. But the harm they have done diffuses harm, for it weakens credit still further.
When we understand that Lombard Street is subject to severe alternations of opposite causes, we should cease to be surprised at its seeming cycles. We should cease too to be surprised at the sudden panics. During the period of reaction and adversity, just even at the last instant of prosperity, the whole structure is delicate. The peculiar essence of our banking system is an unprecedented trust between man and man; and when that trust is much weakened by hidden causes, a small accident may greatly hurt it, and a great accident for a moment may almost destroy it.”
Chapter VI: Why Lombard Street Is Often Dull, And Sometimes Excited
Lombard Street: A Description of the Money Market
By Walter Baghot, 1873
For those who missed the period from late September to mid January, little changed in the stock markets. Stocks declined marginally, but not out of line with the deterioration in fundamentals. Earnings projections remain positive for 2019 and valuations have slightly compressed. However, for investors who lived through this period, the markets took them on a wild ride, more reminiscent of a roller coaster at Six Flags than a placid pond. Most investors probably reached for the Dramamine more than once or twice and left feeling somewhat nauseous.
However relatively flat the performance of the markets over the past 5 months, appearances can be deceiving, as underneath the surface of the markets, all is not well. Margins compressed for the market as a whole, as cost pressures began to rise. International economies slowed or shrank, impacting the 50% of earnings that are sourced outside the US. And revenue growth slowed with more to come. While the Fed change in policy direction from tightening to neutral in January was viewed positively by the markets, the Federal Reserve does not move away from tightening for no reason. Leading indicators show further deceleration ahead with recent economic data providing harbingers of what may come. And the US Dollar, coupled with foreign economic weakness will likely put pressure on corporate earnings projections. The issue for the 2019 expected earnings growth for the US markets can easily be shown via the following chart:
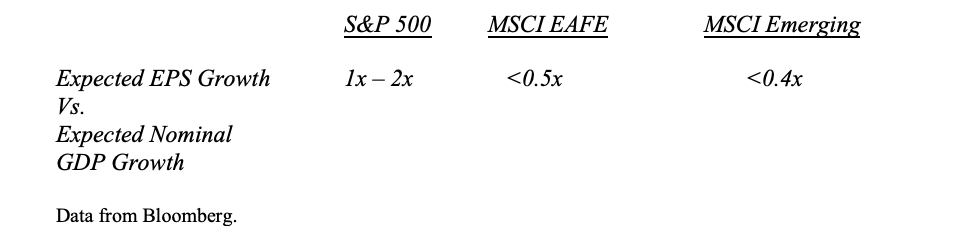
In other words, US Markets appear to price into the average stock a relatively optimistic outcome. This is despite a slowing economy. And this is despite currency issues, as the US Dollar continues to rise against the Emerging Market Currencies. The easiest way to see this is the drop in EM currency values against the US Dollar:
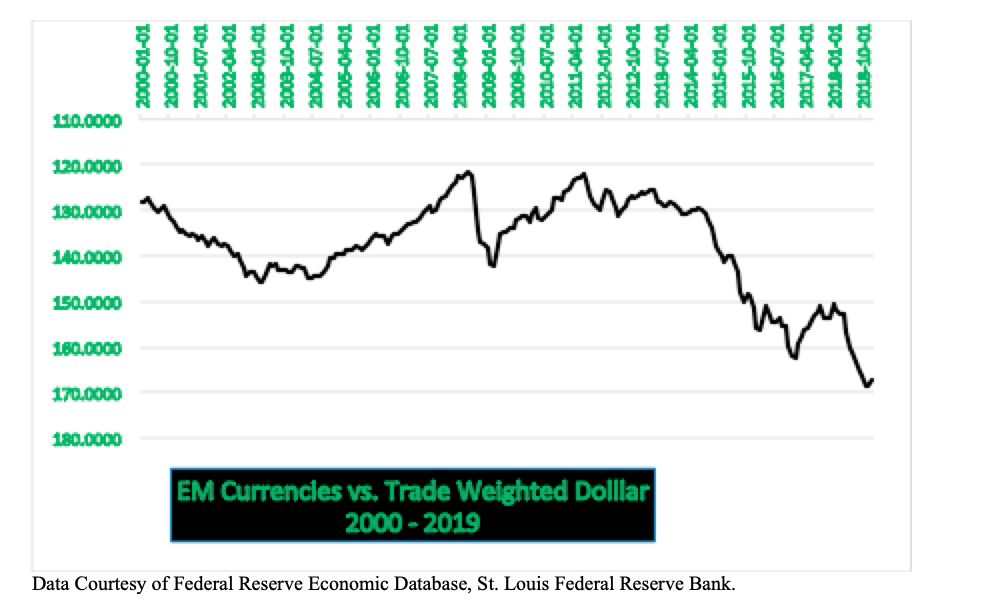
And while it is true that the currencies of Europe, Japan, and Canada remain within their traditional long term bands, almost 60% of trade occurs with the Emerging Markets. Thus, to discount their impact would be inappropriate.
In addition, to the above short term issues, there is the longer term issue of valuation. The easiest way to view this issue is Robert Shiller’s CAPE Ratio (Cyclically Adjusted Price Earnings Ratio). The CAPE along with numerous other indicators, such as Equity Market Value to GDP, the Buffet Indicator, or Tobin’s Q, continue to flash Red, based on long term valuation:
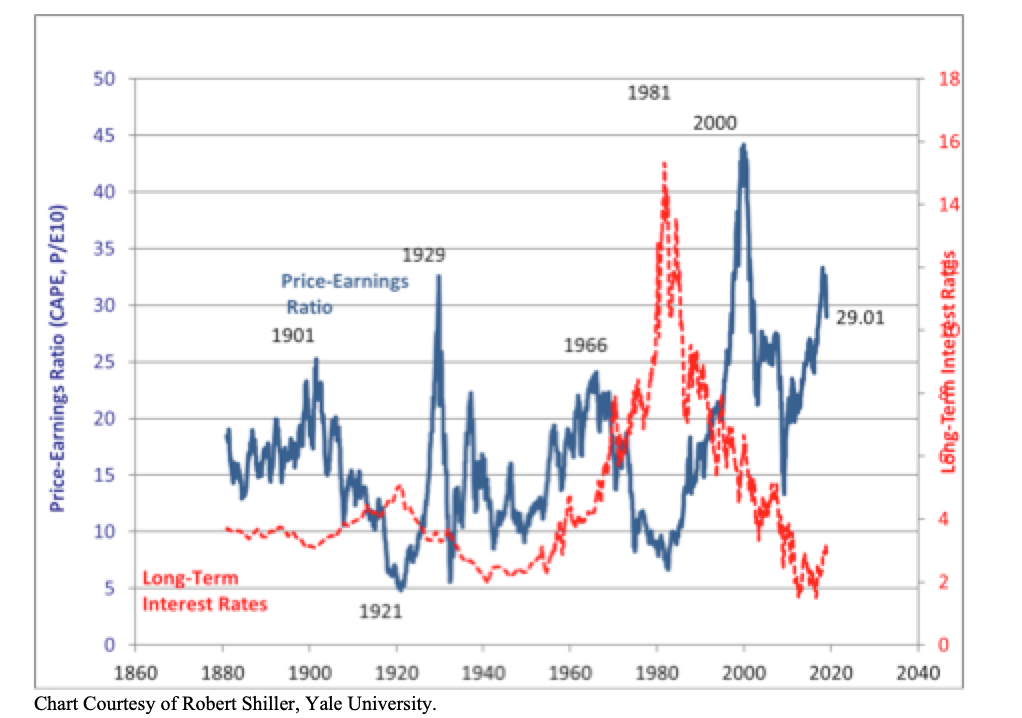
Readings, such as these, correlate with very low to no increase in the markets over a decade. So, buy and hold investors can expect compound returns, including dividends, of 3% – 5% over the next 10 years. This, of course, will come with significant volatility, as the markets typically volatility is 15% over the long term. With the majority of the public having now indexed to the market via Index Funds and ETFs, the public stands positioned in just the right manner for the past 10 years, but likely in just the wrong manner for the investing environment ahead over the next decade. (Please see Everyone In The Pool: Indexing, ETFs, Smart Beta, and Quant Strategiesfrom July 31, 2017 and The Cult of Indexing: All Hands on Deck, 1960s Aheadfrom January 31, 2018.) This would be similar to their move into mutual funds in the late 1990s, when those products came to dominate the investment scene.
In addition to this, the stocks of the growth companies, that have led the market upward over the past decade, bear eerie similarities to those of an earlier growth stock era in the 1990s. The easiest way to see this is by looking at Amazon. It, like Cisco in the 1990s, led the market over the past decade, providing outsized returns to investors with its stock reaching over 100x forward earnings at its peak last year. Today, that is down to a mere 70x to 80x forward estimates depending on the earnings assumed. This is similar to the path that Cisco demonstrated. Cisco came public at a split adjusted price of $0.06 per share in 1990 and reached $1.87 by 1995 with a market cap of $9.5 billion. The company then went on a 5 Year acquisition spree that drove its stock upward. Eventually, the value of the company peaked at $588 billion in March of 2000 or $78.22 a share. Of note, actual earnings in 2000 were $0.50 per share. So, the stock traded at almost 160x forward earnings. Of course, the stock then crashed spectacularly in the ensuing bear market. The following chart shows this incredible ride for investors and the aftermath:

Not surprisingly, earnings crashed as well, with the company earning just $0.10 per share in 2001. Below is the chart of Amazon’s stock:
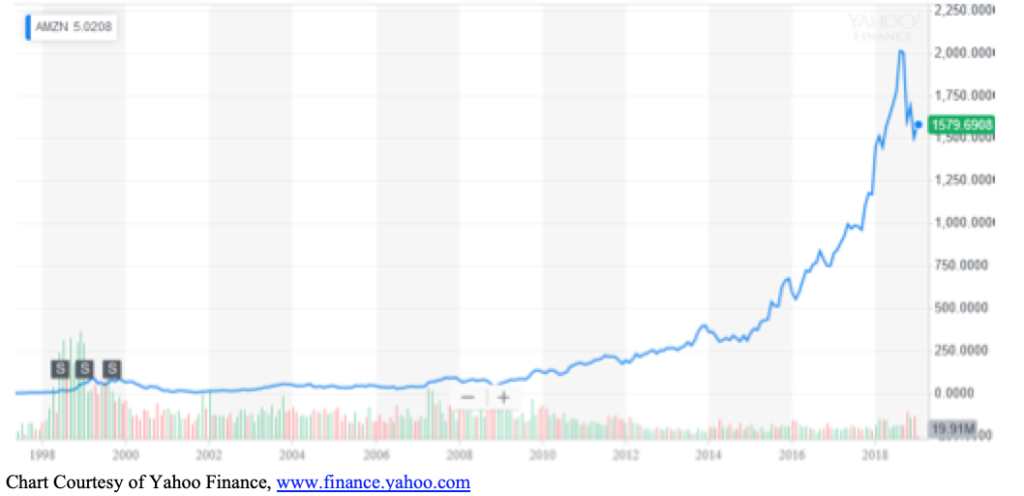
What is striking is how this chart resembles the Cisco chart from 1990 – 2000. One can note how Amazon’s stock, in just six short years from 2012 – 2018, went up over 8x. This is similar to the rise in Cisco from 1997 – 2000, when it rose over 8x as well. With Amazon’s fundamental growth slowing, it appears a correction in the stock has begun as the stock now must wait for earnings to catch up. This would be similar to the problem that Cisco experienced back in 2001, when Cisco’s growth slowed and the stock crashed. The stock spent over a decade waiting for earnings to catch up before moving sustainably higher. Despite this catch up by corporate earnings and the sustained move upward since 2016, Cisco’s stock price remains below its 2000 peak. (For those who wish to view a major technology company that exceeded its 2000 peak, the long term chart of Microsoft would illustrate this. It took the company a mere 16 years to exceed its 2000 peak.) For Amazon today, its stock appears in a similar position, as a number of years must pass before earnings can catch up to the stock price. The only question is how long. Other current market favorites, such as Facebook, appear to be tracing out similar paths. Given the performance of the market leaders, it appears the markets are making a Visit to the Late 1990s with an early 2000s reprise ahead.
Despite the historical valuation data noted above; the real questions about future earnings for the market; and a potential peak in the growth stock prices of the market leaders of this bull market, the US markets appear to be taking a nostalgic ride back into the 1960s with the ups and downs of the markets and the vicissitudes of global Central Banks following a similar path to those years. A quick review of the historical record will illustrate this point. After tightening in 1966, the US Federal Reserve panicked due to the 21% drop in the stock market. As a result, it ended its tightening and actually eased policy starting in late 1966 and continuing through the first part of 1967. Of course, the markets responded by undoing their drop of 1966 and going to new heights. However, in a classic stop-start pattern, the Federal Reserve started to tighten again in late 1967 and continued to squeeze through 1968, this time going too far and producing the 1969 – 1970 Recession. As a result, the markets traced out the following pattern:
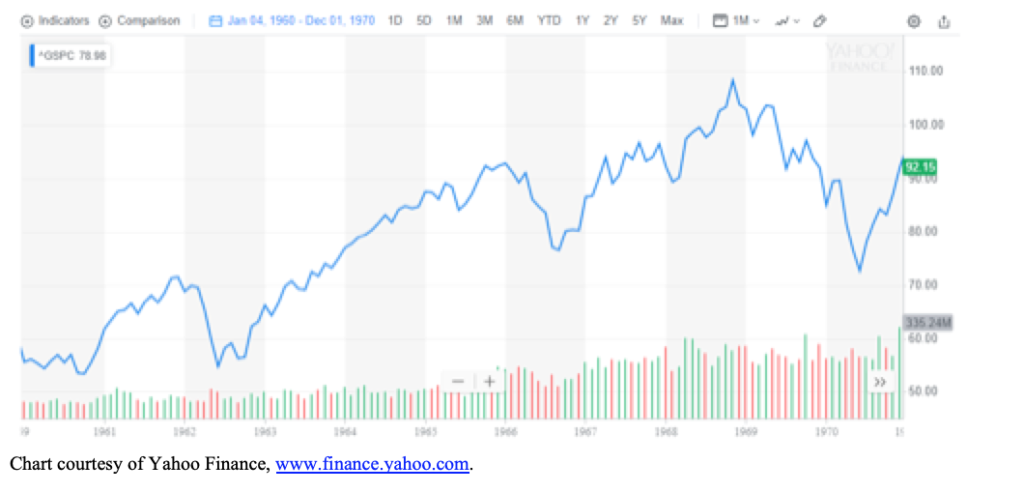
As is clear from the above chart, the markets stood at the same place in 1970 as they did in late 1965. And while the markets did go briefly to new heights in late 1968, this proved unsustainable in the face of Federal Reserve actions.
In 2018, the markets dropped almost 21%, a similar amount to 1966. With the Fed putting its tightening on hold early this year, the markets have basically recouped most of their losses. Should the Fed continue this policy or possibly ease, Chinese stimulus prove effective, a deal on trade occur, and Europe act to stimulate its economy, the markets could potentially rise back to their prior highs or even exceed them over the next eighteen months as global economic growth reaccelerates, in a similar fashion to 1967 – 1968. However, with low US unemployment and wages accelerating, the Federal Reserve likely would resume tightening sometime in 2020, assuming growth reaccelerates bringing along higher inflation, just as occurred in the back half of 1968. This time, as in other prior episodes, the Fed would likely go too far, precipitating a recession. This would create the inevitable bear market. Thus, the market level in 2022 might look like the market level in 2017. This would be similar to the period from 1965 – 1970, whereby the market provided a 0% price return over 5 Years and all return came from dividends. For investors who have indexed their futures to the markets, this would come as a shock. If, in addition, inflation picked up, the markets could end up providing them a Negative Real Return, as occurred from 1965 to 1970, with the potential for a decade to follow like the 1970s. Not quite what the Indexing Doctors ordered. With the current Federal Reserve appearing to follow a similar pattern of stop-start policy and inflation once more starting to pick up, it appears to be A 1960s Springtime for the Bourses once again. (Data from Robert Shiller at Yale University, Federal Reserve of St. Louis, Yahoo Finance, Bloomberg, and company reports coupled with Green Drake Advisors analysis.)
Confidential – Do not copy or distribute. The information herein is being provided in confidence and may not be reproduced or further disseminated without Green Drake Advisors, LLC’s express written permission. This document is for informational purposes only and does not constitute an offer to sell or solicitation of an offer to buy securities or investment services. The information presented above is presented in summary form and is therefore subject to numerous qualifications and further explanation. More complete information regarding the investment products and services described herein may be found in the firm’s Form ADV or by contacting Green Drake Advisors, LLC directly. The information contained in this document is the most recent available to Green Drake Advisors, LLC. However, all of the information herein is subject to change without notice. ©2019 by Green Drake Advisors, LLC. All Rights Reserved. This document is the property of Green Drake Advisors, LLC and may not be disclosed, distributed, or reproduced without the express written permission of Green Drake Advisors, LLC.