The Equity Markets: Policy Led to Policy Fed or It’s 1966 Again

“However, the risk of paying too high a price for good-quality stocks – while a real one – is not the chief hazard confronting the average buyer of securities. Observation over many years has taught us that the chief losses to investors come from the purchase of low-quality securities at times of favorable business conditions. The purchasers view the current good earnings as equivalent to ‘earning power’ and assume that prosperity is synonymous with safety. It is in those years that bonds and preferred stocks of inferior grade can be sold to the public at a price around par, because they carry a little higher income return or a deceptively attractive conversion privilege. It is then, also, that common stocks of obscure companies can be floated at prices far above the tangible investment, on the strength of two or three years of excellent growth.
These securities do not offer an adequate margin of safety in any admissible sense of the term. Coverage of interest charges and preferred dividends must be tested over a number of years, including preferably a period of subnormal business such as in 1970 – 1971. The same is ordinarily true of common stock earnings if they are to qualify as indicators of earning power. Thus it follows that most of the fair-weather investments, acquired at fair-weather prices, are destined to suffer disturbing price declines when the horizon clouds over – and often sooner than that. Nor can the investor count with confidence on an eventual recovery – although this does come about in some proportion of the cases – for he has never had a real safety margin to tide him through adversity.”
Chapter 20: “Margin of Safety” as the Central Concept of Investment
The Intelligent Investor, 4thRevised Edition
By Benjamin Graham, 1973
For investors, the Year 2018 started with much promise. Stocks soared in January, continuing their run from 2016 and 2017. However, as one might say, A Funny Thing Happened on the Way To The Forum as investors grew nostalgic for the markets of yesteryear. Unfortunately for investors, they actually returned, along with all their volatility. From its starting point of 2674 at the beginning of the year, Mr. Market soared to 2873 in January, only to plunge in February, sending investors on a rollercoaster ride for the rest of the year. Oh, the wonders of the past. And it has been quite a ride too. From Mr. Market’s low of 2582 in April, it soared to 2931in September. Only to plunge again in October, ending the month at 2712. If an investor went on a 10 month vacation, he or she would have thought it a ho-hum year as the market rose less than 2% since the beginning of the year with a projected total return for the year, including dividends, of just 4%. Below average, but after several good years, not bad.
However, hidden in the “Ho-Hum Year” and the effective sideways movement of the market stands a looming question. Does 2018 represent the future? Does 2018 represent the type of returns and inherent volatility that I can expect over the next 5 – 10 years in the public equity markets? And, if the answer is yes, do other asset classes, such as fixed income, real estate, … represent alternative opportunities with competitive returns and less volatility over the next decade? While short term predictions of equity market movements sit in the trash can of history, as they have been proven wrong over and over again, longer term predictions, based on valuations, economic growth, and interest rates, demonstrate high levels of validity.
The easiest way to understand where the markets sit today involves a trip back in history to the 1960s. The economy enjoyed low inflation and strong growth through 1965. But the Federal Reserve became worried about inflation in 1965, due to the low unemployment and strong growth, embarking on a tightening campaign late in the year. Despite vocal protests from the President, Lyndon Johnson, William McChesney Martin, Chair of the Fed, raised rates until November 1966, increasing them from just 4.00% in September 1965 to 5.75% in November 1966:
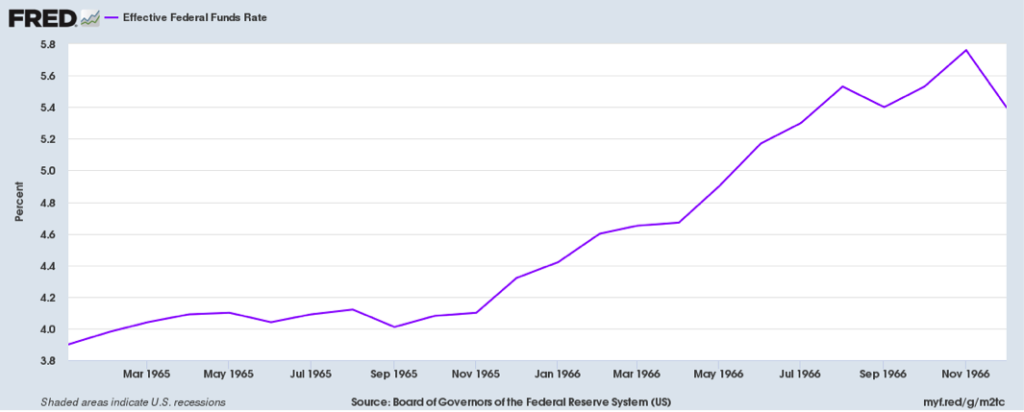
The Federal Reserve’s goal was to slow the economy, which it did. Economic growth went from ~8% in 1965 to run rate of less than 4% by the end of 1966.
The equity markets did not take the Fed’s campaign well, as they needed to discount the expected slowing in economic growth as well as the impact on valuation of higher interest rates:
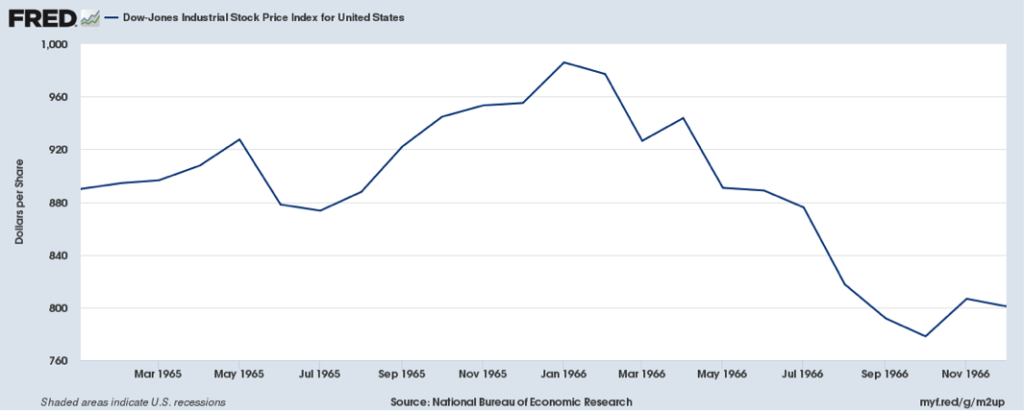
When the dust cleared, markets stood 21% lower in response to the Fed. Profits continued to grow at a reasonable clip, but the rise in interest rates forced stock valuations lower.
As the Fed then eased, markets rose once more, but not much above their January 1966 high before the Fed entered another tightening campaign, this time plunging the economy into the 1969 – 1970 Recession. Of course, the following 10 years proved disastrous for the Equity Markets, despite Real GDP growing almost 40% from $4.9 trillion in Q1 1970 to over $6.8 trillion in Q4 1979 or at a 3.3% compound rate. While reasonable economic growth occurred, despite the 1974 – 1975 Recession and the two massive increases in oil prices, the rise in inflation coupled with the significant increase in interest rates compressed stock valuations, creating negative real returns for equity holders.
If we move from the 1960s back to today, the real question comes down to the long term valuation of the markets coupled with the underlying rate of inflation. And most of the indicators, with proven track records, do not predict a rosy 10 years ahead. The most obvious one is Robert Shiller’s Cyclically Adjusted Price Earnings Ratio (CAPE). This indicator possesses a long history of projecting returns 10 years hence. Here is what it shows for the markets:
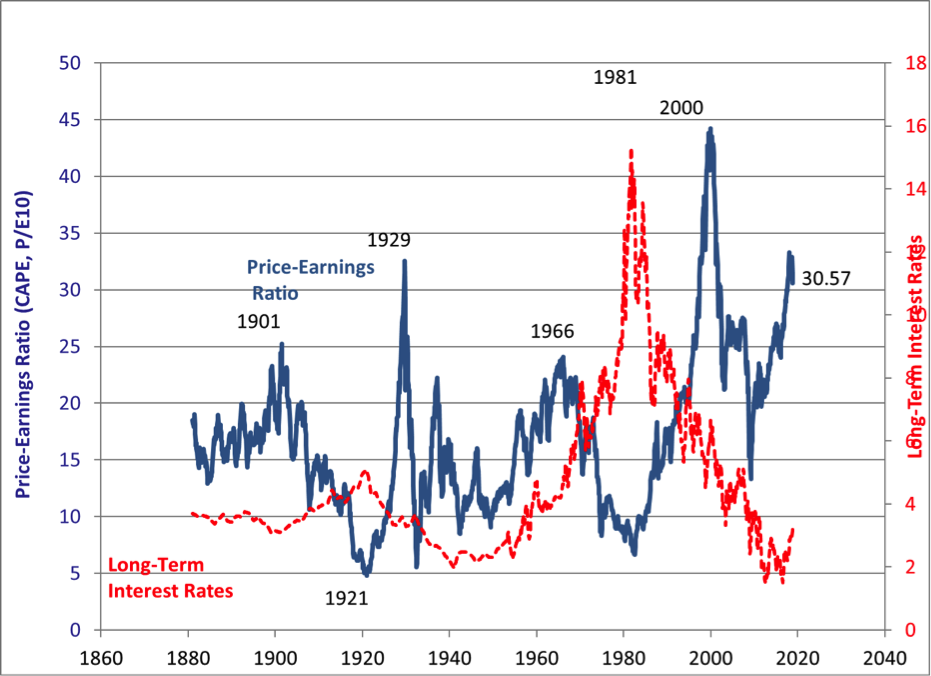
As the above chart shows, valuations stand at levels similar to 1929 and were only exceeded in 2000 during the Tech Bubble. Ten Year Forward Returns were nothing to write home about from those starting points.
There are two other statistically valid indices that correlate well with Ten Year Forward Returns. They are Household Stock Ownership as a Percent of Financial Assets and Tobin’s Q. The former makes intuitive sense as high levels of stock ownership should mean the public is “All In”. Unfortunately, today’s level of stock ownership sits at over 40%. This level is up from 20% at the bottom of the market in 2009 and above the 37.5% peak in 2007 and the 37.7% peak in 1968. And, not surprisingly, just as with the CAPE, it only was eclipsed by the peak in 2000. The following chart shows Tobin’s Q:
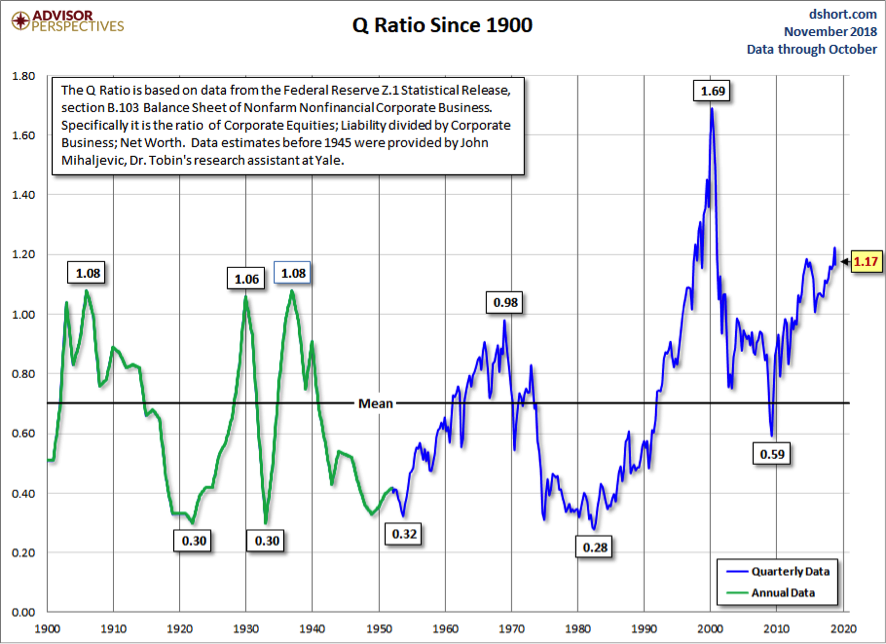
Tobin’s Q presents a similar picture. Stocks relative valuations stand at levels slightly above those seen in 1907, 1929, and 1968 but below the peak in 2000.
However the data presents itself, the Equity Market sits at valuation and household allocation levels that historically deliver mediocre to poor returns. With the Federal Reserve continuing to raise rates, Equity Valuations will continue to come under pressure just as they did in 1966, as they move from a Policy Led to Policy Fed environment. And, with the US Government’s balance sheet in a shambles and unfunded social obligations spiraling upward, the odds of the government resorting to the printing press to solve its debt, as it traditionally does, continue to rise. (For an analysis of the US Government’s unfunded social program obligations, please see I Can Tell A Lie: Government Promises & The Pot Of Gold At The End Of The Rainbow.) Should this occur, then inflation could take off just as it did in the late 1960s when inflation hit 6% at the end of the decade, up from 1.2% early on. With these two fundamentals in ascendance, it looks like It’s 1966 Again. (Data from Robert Shiller, Federal Reserve, and the Census Bureau coupled with Green Drake Advisors analysis.)
Confidential – Do not copy or distribute. The information herein is being provided in confidence and may not be reproduced or further disseminated without Green Drake Advisors, LLC’s express written permission. This document is for informational purposes only and does not constitute an offer to sell or solicitation of an offer to buy securities or investment services. The information presented above is presented in summary form and is therefore subject to numerous qualifications and further explanation. More complete information regarding the investment products and services described herein may be found in the firm’s Form ADV or by contacting Green Drake Advisors, LLC directly. The information contained in this document is the most recent available to Green Drake Advisors, LLC. However, all of the information herein is subject to change without notice. ©2018 by Green Drake Advisors, LLC. All Rights Reserved. This document is the property of Green Drake Advisors, LLC and may not be disclosed, distributed, or reproduced without the express written permission of Green Drake Advisors, LLC.