Dragon Moves, A Setting Sun, The Yin and The Yang, Elephant Times, The Party Revs Up, Old Man Turmoil, and The Continuing Climb

“These findings suggest an alternative rationale for the existence of tariffs, namely as a means of internalizing an externality – in this case, the cost of making markets. In other words, tariffs, at least to begin with, would not have been developed as a means of discouraging trade, but rather as a means of collecting the government revenue that would otherwise have been lost (i.e., by dealing with foreigners) – in short, to internalize the externality that is benefitting from markets without having contributed. The tariff, in this case, represents the user’s contribution to making markets.”
Chapter 3: The Theory of Network Trade
Interregional and International Trade: A Network Approach
By Bernard C. Beaudreau, 2008
“The central goal of government policy toward the economy is to deploy a nation’s resources (Labor and Capital) with high and rising levels of productivity. As I have discussed earlier, productivity is the root cause of a nation’s standard of living. To achieve productivity growth, an economy must be continually upgrading. This requires relentless improvement and innovation in existing industries and the capacity to compete successfully in new industries. New business formation is necessary to create jobs for new persons entering the workforce, to replace any jobs freed up by productivity gains in other successful industries, and to replace jobs lost in less productive industries that become uncompetitive.
The proper role for government policy toward a nation’s industry is to stimulate such dynamism and upgrading. Government’s aim should be to create an environment in which firms can upgrade competitive advantages in established industries by introducing more sophisticated technology and methods and penetrating more advanced segments. Government policy should also support the ability of the nation’s firms to enter new industries where higher productivity can be achieved than in positions ceded in less productive industries and segments.
One manifestation of an upgrading economy is the movement of less productive jobs to other nations via foreign investment and foreign sourcing. This is a healthy process if it is indeed the less productive jobs that are moving overseas. If high productivity jobs are lost to foreign rivals, as has been the case in a number of U.S., German, and British industries in the past decade, long-term economic prosperity is compromised.”
Chapter 12: Government Policy
The Competitive Advantage of Nations
By Michael E. Porter, 1990
Global economic warfare continues to break out between countries. The United States finally responded to the attacks on its economy by China, with tariffs and embargoes. And while Wall Street sees a truce ahead, the truce resembles the 1940 Sietzkrieg or false peace. As in World War II, this truce likely will prove temporary as both sides position themselves for the warfare ahead. With China actually taking damage for the first time in the conflict, it pulled back to regroup its economy. The US strategy stands clear. Hamstring China’s participation in the major trade networks across the globe while rebuilding US industry. Develop new technologies in 3D/ Additive Manufacturing that obsolete China’s industrial base. And force industrial capacity back to the US by restricting the export of key industrial technologies. For example, ban the export of key semiconductor capital equipment needed by China to finish its $100 billion investment into semiconductor plants, creating stranded investment for the country. Given the massive excess capacity in China built to feed its export machine, this strategy would undermine the Chinese economy. (Please see Strategy for American Leadership in Advanced Manufacturing from the National Science & Technology Council. The report may be found at: https://www.whitehouse.gov/wp-content/uploads/2018/10/Advanced-Manufacturing-Strategic-Plan-2018.pdf.) China, of course, will move to counter the US, attempting to buy economic influence with its Belt and Road Infrastructure Program (BRI) in order to export its excess capacity and keep its factories humming. But with the costs of the Chinese debt that come alongside the BRI “infrastructure gift” becoming apparent, countries across the globe began to rethink accepting this Trojan Horse over the past year, lest they become indebted to China and subject to becoming its vassal. This occurred with Sri Lanka when China forced the country to hand over control of a major port when it could not meet its debt to Chinese banks. This port just happened to position the Chinese strategically close to India and in a position to support their influence over the Indian Ocean. The Malay people threw out the existing government, which planned to allow Chinese BRI projects equivalent to more than 10% of its GDP. The new government cancelled major projects and the debt associated with it to avoid ceding control of key portions of its economy to China. And Pakistan, having accepted the infrastructure gifts, asked the US via the IMF and World Bank, to bail it out of the debt that came along with the “Gifts” as it realized its error. (The US made clear it would help, but that none of the monies could go to repay Chinese loans. They would need to be written off as part of an aid package.) With the economic stakes rising, the global rivalry accelerating, and the true costs of the BRI becoming clear, countries will need to start to take sides, in a conflict that likely will grow to include much of the globe.
In China, the economy clearly took some serious hits over the past year. The industrial sector, comprising almost half the economy, continues to slow. Fixed Asset Investment (FAI) continues to decelerate, falling to just 5.4% growth year over year, reaching its lowest growth in over 30 years. Consumer spending, that engine of the economy, also appears to have taken on some gas. Foreign companies report slowing growth in areas as diverse as water heaters, autos, and clothing. And Total Social Financing (TSF) fell to less than 11% growth year-over-year, as shadow bank lending continues to drop. The Chinese government’s actions, coupled with a ban on media reports of any negative economic issues, indicate the depth of the problems. Historically, when governments get in economic trouble, they move to control the press and the media in order to prevent the populace from knowing the reality of the situation and to forestall widespread social unrest. This media ban stands consistent with a number of Chinese economic moves that indicate significant issues despite the greater than 6% GDP Growth reported by the government. For example, the Government lowered Required Reserve Requirements (RRR) twice already in order to provide more lending to the economy, with expectations of a third cut over the near term. Each RRR cut is expected to provide over $100 billion of stimulus to the economy. In a $12 trillion economy, these cuts will equate to 2.5% of GDP. In addition to this stimulus, the government stepped on the Real Estate gas pedal to offset the slowdown in true industrial investment and prevent FAI from collapsing. Floorspace started rose over 30% year over year. These traditional actions seem to have put some brakes on the slowing in the Chinese economy.
However, contrary to policy focused on cleaning up its economy from inefficient investment, the Central Government reversed its stance on Local Government Debt issuance. This issuance almost doubled starting in August, in order to stimulate the economy through industrial investment and additional infrastructure. With China already producing 50% of the steel in the world and 57% of fiber optic cable, the country now is building offshore rigs and other fixed assets to fill up its factories. Where these assets will find productive uses is anyone’s guess. Local Government Debt fulfills one other key purpose: propping up existing companies. Chinese companies often back their loans with pledges of their publicly traded shares as collateral. In fact, estimates show this equates to $550 – $600 billion in stock or 10% – 12% of all publicly traded stocks on the A Shares market. When the Chinese market corrects and shares decline, companies face two issues. First, creditors sell the pledged shares to meet their collateral needs. Second, as the value of the shares falls, companies face liquidity issues as loan limits are lowered. By providing direct liquidity to companies and/or buying shares in the open markets, the local governments effectively rescue corporations from their liquidity squeeze. With both local and central government spending on the rise, the overall government budget deficit is expected to exceed 11% of GDP in 2019. And while stimulative, there exists a large “But”. This “But” comes down to the following. With both government and private entities adding to their debt outstanding, the Debt to GDP Ratio will continue to rise. That ratio stands at almost 300%, up from ~200% in 2012. Despite this massive rise, Chinese GDP grew only 45% over the last 6 years. With the Chinese economy so vast and overcapacity already evident in almost every area of the economy, the ability of the government to create fundamentally sustainable growth via rising FAI and debt issuance remains a question, as the marginal impact of government spending continues to drop. Translated into English this means that China cannot continue to add debt to support growth because at some point it becomes unsustainable as what it is building cannot support the interest payments let alone repay the debt. A simple example will illustrate this point. The Chinese auto market sells 26 million cars per year. Yet, the country possesses capacity to build 60 million cars. In a normal economy, competitive pressures would force the closure of 40% or more of this capacity. Yet, China continues to add capacity through new Electric Vehicle plants. While these Dragon Moves may sustain economic growth short term, with China completing its build out of every industry by the early 2020s to meet its Made in China 2025 plans and Debt to GDP rising to critical levels, economic growth could grind to a halt, as overcapacity across its economy finds access overseas limited and there exists insufficient demand at home to absorb the vast quantity of goods its factories can produce. The potential for a full blown credit crisis continues to grow that would make the 2008 Housing Bust in the United State look small.
For Japan, linking its economy with China may provide little solace. Despite this or maybe due to this, its economy actually shrank in Q3. While commentators seek to blame typhoons and earthquakes, other forces appear ascendant that have little to do with the forces of nature. For example, Residential Investment shrank year over year. Industrial companies reported slowing growth in demand for key industrial parts. Both Fuji Electric and Yaskawa Electric cited weakness in Chinese capital spending. Auto suppliers found demand from China shrinking as consumer tax incentives there ended and demand for Chinese autos shrank. For Japanese companies it may be: When China sneezes, Japan catches cold. Furthermore, the Japanese government announced plans to fully implement the VAT scheduled for the second half of 2019. And while moves may occur to blunt its impact, this tax rise will slow the economy. While Japan began to allow more foreign workers into the country this year in order to grow its worker base, this likely will not offset the VAT impact to consumption as these comprise mostly low skill workers. Furthermore, with the Japanese Yen now trading in a range similar to its level from 1997 to 2007 against the US Dollar and the US making noises about the trade deficit over all and especially in autos, Japan’s ability to depreciate its currency and benefit from the improved terms of trade appears limited. With all these drags on the economy, it is time for A Setting Sun after a very, sunny day.
For Southeast Asia, there exists both good and bad. With the rise of China, numerous countries positioned themselves to become suppliers to the vast industrial base, piggybacking on both Chinese growth and the growth in Chinese exports. With China slowing and global export growth stalling, this likely will slow their fundamental economic growth. The salvation may be found in the rejiggering of supply networks as companies move capacity out of China to other locations. Southeast Asia, on a short term basis, at least, will benefit given the existence of large parts of the supply chain there already. Despite this, the longer term challenge for the region remains. This lies in the US moving to meet its own demand over time removing a large support to industry locally. For example, Foxconn will open the first LCD plant in the US in 2019 after two years of construction. Adidas opened a 3D Manufacturing facility for sneakers in 2017, displacing traditional products made in SE Asia. As other modern manufacturing facilities open over the next 5 years, this will represent a true challenge to the region, which will need to drive up its consumption to support its indigenous manufacturing. For these countries, the Yin and the Yang of this ebb and flow will dominate their futures.
For India, growth continues to normalize with both 2018 and 2019 growth expected to exceed 7%. To understand why this makes sense, a quick look at where India’s consumer stands today will illustrate this clearly. In 2018, Per Capita GDP for each Indian citizen should exceed $1,700 per year. This equals where China stood a decade ago. If India just maintains its growth, this number will more than double over the next decade. With this rise up the income ladder, Indian consumers will want all the goods that every other consumer in China, Thailand, Indonesia, Malaysia, Thailand, … possess currently. For example, the Air Conditioner (AC) possesses allure across all of Southeast Asia for obvious reasons. In China a decade ago, when its citizens possessed similar income levels to India today, AC penetration stood at 10x where it stands in India at present. Should India fix its grid reliability and incomes continue to rise, AC demand could explode from the 12.5 – 13.5 million units installed today to over 40 million units installed in a decade. Annual unit sales could grow at 20% for quite some time. And electric demand could explode upward as well. Just putting in place the basic production to create the consumer goods for its vast population along with the necessary infrastructure should drive Indian economic growth for the next couple of decades. With this dynamic, Elephant Times should continue for many years.
In Brazil, the salutary impact of significant Central Bank easing coupled with a massive, 50% devaluation of the currency finally took hold. Economic growth continues to accelerate. Whether related to industrials or commodities, life continues to look better as the party starts to get crowded. According to the latest statistics, Brazilian tractor demand rose 59% year over year and truck demand rose 74% year over year. With Brazil having just cut its labor costs globally in half compared to other countries as well as cut its factory costs, industrial growth turned positive year over year. In fact, it grew at at 18.9% rate for the 3 months ending in August. Reflecting Brazil’s improved global competitive position, Foreign Direct Investment will exceed 3% of GDP this year. Other sectors of the economy not related to trade, demonstrate strong growth as well, such as air travel and telecom. With economic policy finally delivering on the goods, Brazil’s Q3 growth will likely exceed 4% and potentially approach 5%. With a growth rebound fully evident, for Brazilians, finally, The Party Revs Up.
For Europe, the hope for another decent year of GDP growth appears destined for disappointment. Trade growth ground to a halt, hurting German economic growth. In fact, for 2018, Germany may grow just 0.5%. This coupled with the turmoil in Italy, the fourth largest economy in Europe, and the upcoming exit by the UK, leaves Europe with many questions moving forward. At the end of the day, it pits national interests against the pan-European interests of the bureaucrats in Brussels and questions of national sovereignty. Do the citizens have the right to elect a government that represents their interest and that will take actions that the majority supports? At the end of the day, revolutions are born out of frustrated citizens who believe the government no longer represents them. The bureaucrats in Brussels appear to have forgotten this critical fact. With Italy likely to defy the EU on its budget, moving to set up a parallel currency in the BOT, and preparing its financial system for turmoil, relations will continue to deteriorate. And given the country endured the worst economic growth over the past decade since the Great Depression as a result of its entry into the EU coupled with giving up control of its currency, undoing these policies becomes a logical step to restore economic growth. Should Italy depart the EU in addition to Great Britain, the burden of carrying the EU will fall on French and German citizens as the budgetary contribution from London and Rome dissipate. To what extent will these citizens accept higher taxes and lower government benefits as more monies flow to Eastern Europe to make up for the departures? While Eastern European growth continues at 4% or better, at least 1.5% comes from the transfer of monies eastward. Another chunk comes from the supply of auto parts and other industrial components to Germany and France to export cars. With the Italian moves, the EU appears at risk of slowly but surely flying apart as Old Man Turmoil rises.
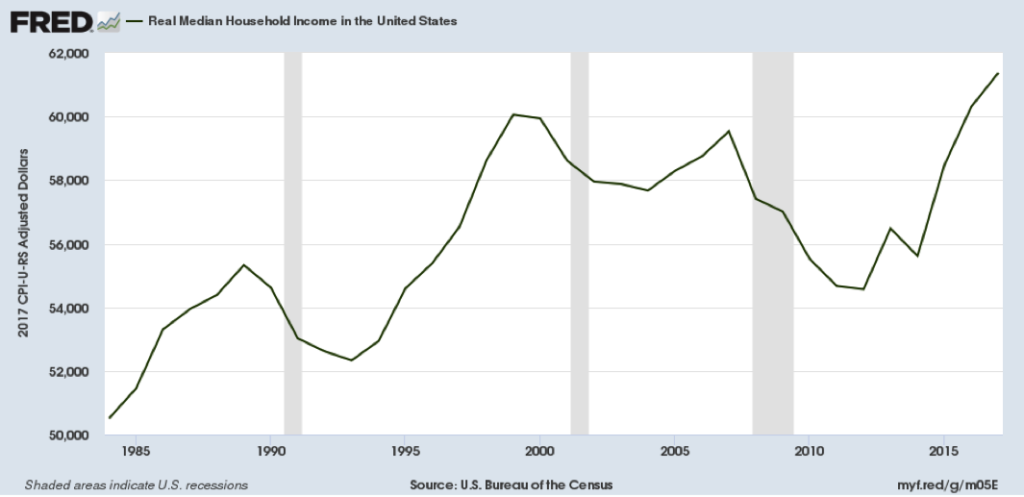
For the United States, the year 2018 will deliver the best economic growth since 2005. This will occur despite the slowdown in housing, the rise in the currency, and the continued increase in interest rates by the Federal Reserve. In fact, economic growth for the year looks set to exceed 3% as the US moves towards a late cycle posture driven by consumer spending, capital investment, and government spending, the traditional drivers of late cycle economic growth. For the average American, things finally are looking up. Real Median Wages for a family finally sit above their level in 1999 and continue to climb, as the following chart demonstrates:
In addition, with an emphasis on reclaiming its economic growth, US capital spending finally exceeded its highs from the 2002 – 2007 recovery. Government data show US Industrial Equipment spending now stands 8% to 10% above 2007 levels and continues to rise. Other types of equipment spending have recovered back to their 2014 levels and stand almost 15% above their 2007 levels. In the key areas of technology investment, Information Processing Equipment continues to soar, standing 20% above its 2016 levels and over 100% above 2007 levels. Software Investment stands almost 200% above 2007 levels.
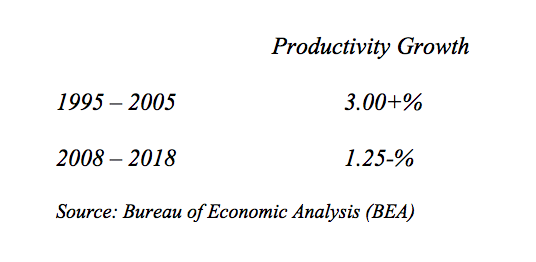
However, there is still one area of Investment still underperforming, Manufacturing Structures. Current real investment in these structures stands below where it stood in 2007 despite the economy standing 20%+ larger. And it is down in 2018 after falling in 2017. This is likely the result of the US Dollar rise, starting in 2014, that drove the US Dollar to record levels. With manufacturing intimately tied to Productivity Growth, addressing this Investment remains critical for the United States to restore its long term economic growth to pre-2008 levels of 3.5% – 4.0% in annual GDP growth. The following table illustrates the Productivity challenge:
Nevertheless, improvement in this key metric started with the change in Presidents in 2017, as the US once more encouraged manufacturing domestically over abroad. This change in policy began to drive volumes upward in domestic plants, enabling Productivity Growth to start to move more in line with its long term averages:
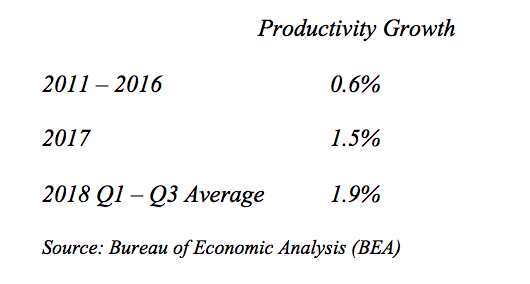
As the above date demonstrate, US Productivity Growth continues to grind higher, despite the criticisms of the current US economic policy. Should Q4 come in better than 2%, the US would deliver its first year of 2%+ productivity growth, excluding the bounce from the recession, since 2006. With the addition of manufacturing investment, Productivity stands poised to sustainably move higher, which would underpin long term, faster economic growth.
For those who think this does not matter, imagine if the US grew at its historical economic growth rates from 2009 – 2018. The US economy would stand at $25 trillion in size, not its actual size of $20 trillion. This would mean $500 billion in additional revenue to the US government, cutting today’s deficit in half. This would mean $250 billion in additional revenue to state and local governments, helping them to address their pension issues and increase infrastructure spending. This would mean an extra $3 trillion in additional income for the average American or Real Incomes 15% above levels today, enabling them to bring their debt in line with longer term debt to income ratios along with enabling higher consumer spending. This would mean much higher levels of earnings for corporations, likely supporting much higher levels of corporate investment as well as pushing the equity markets to higher levels than exist today.
All of these salutary impacts, of course, don’t exist. But imagine what it would mean for the US should it restore Productivity Growth to better levels. The biggest impact likely would occur at the Federal Reserve. With the Fed assuming the economy can grow only 2%, at best, over the long term, it tightened financial conditions over the past two years to slow economic growth. But, if Productivity Growth sustains at 2%, then Real Potential Growth for the US rises to 3% or more. This would force a major rethink of Federal Reserve policy and where inflation would really kick in. Despite a Fed tightening financial conditions and the rise in the US Dollar, which will slow exports next year, Productivity Growth appears set to change the US growth dynamic, enabling an offset to these drags on its economy. And with this fundamental change in the economy, the US should make The Continuing Climb. (Data from OECD, BEA, US Census Bureau, the Federal Reserve, and Company Reports coupled with Green Drake Advisors analysis.)
Confidential – Do not copy or distribute. The information herein is being provided in confidence and may not be reproduced or further disseminated without Green Drake Advisors, LLC’s express written permission. This document is for informational purposes only and does not constitute an offer to sell or solicitation of an offer to buy securities or investment services. The information presented above is presented in summary form and is therefore subject to numerous qualifications and further explanation. More complete information regarding the investment products and services described herein may be found in the firm’s Form ADV or by contacting Green Drake Advisors, LLC directly. The information contained in this document is the most recent available to Green Drake Advisors, LLC. However, all of the information herein is subject to change without notice. ©2018 by Green Drake Advisors, LLC. All Rights Reserved. This document is the property of Green Drake Advisors, LLC and may not be disclosed, distributed, or reproduced without the express written permission of Green Drake Advisors, LLC.