Equities: Where’s the Cash?

“The normal tendency of the marketplace, it is assumed, is to drive prices to extremes. When optimism is dominant, conceptions of value are liberalized, and prices rise steadily. Ultimately, it is recognized that the optimism was excessive, and prices react downward. As prices fall, caution turns to fear, and the price decline snowballs until it is finally recognized that the pessimism was overdone. At this point a price reversal occurs once again. The successful evaluator of common stocks, therefore, will try to avoid becoming overly optimistic or overly pessimistic. He will attempt to determine the approximate level around which the price tides will swell and ebb.”
Investment Analysis and Portfolio Management
Chapter 5: Valuation of Common Stocks: A Framework
By Jerome B. Cohen and Edward D. Zinbarg, 1967
“The Stock market is essentially a ‘market for income,’ and prices tend in the long run, despite many variations, to coincide approximately with true worth. Temporarily, however, many factors are instrumental in bringing about enormous fluctuations in prices, sometimes as regards individual securities and at other times with respect to practically the entire list. Briefly classified, these price factors may be grouped under the following heads:
- The intrinsic earning power of the corporations whose securities are under consideration.
- The condition of the money market.
- Financial panics and business depressions.
- Rising commodity prices and other factors influencing the general level of prices overconsiderable periods of time.
- Current events, such as wars, conflagrations, etc., of a character not easily susceptible to discounting.”
The Stock Market
Chapter XVIII The Money Market In Its
Relation To Security Prices
By S.S. Huebner, 1922
The US Equity Markets continues to grind upward, challenging the highs established in January. With the strongest economic growth since 2010 and tax cuts boosting net income, companies reported strong bottom line growth. In addition, with the opportunity to repatriate monies given under the tax bill, numerous corporations are bringing the cash home. They are using this to fund massive stock buybacks, estimated at ~$1 trillion this year. But for the investor, these bottom line results, with earnings rising over 20% coupled with increased share buybacks, did not lead to rapidly rising prices. The markets rose only 1.7% in the first half, although they did rise strongly in July. This brought the year to date returns to up 5.3% for the average equity investor, providing a chance that the year could turn into an average year for returns, with a return to normal volatility for the market. This, of course, assumes the Trade War between the US and China does not escalate into something else and that the Federal Reserve restrains its natural tendency to raise rates whenever unemployment is low.
Unlike the near term, which could provide reasonable returns, the long term looks much less rosy. This stems from the starting point for valuations and the likely reversion to the mean for many corporate financial health measures. These combined indicate that equity investors will earn much lower returns over the next decade. One of the best indicators of long term returns remains the P/E 10, also known as the Shiller P/E, which measures the market’s value against the average of the past 10 years of earnings. The most recent chart of this indicator is flashing red for the long term:

Chart Courtesy of Advisor Perspectives.
While the chart above shows percentage deviations from the mean, the current value of the Shiller P/E stands at 32.29, exceeded only in September 1929 when it registered a reading of 32.59 and in the Tech Mania from 1998 to 2001, during which it rose into the 40’s for 18 months. (Data are available at Robert Shiller’s website at Yale at http://www.econ.yale.edu/~shiller/data.htm.) Neither of those starting points delivered good 10 Year returns for investors. Other measures, such as the Q Ratio deliver a similar message. The following Table lays out the reading of the Q Ratio at key turning points in the market over time:
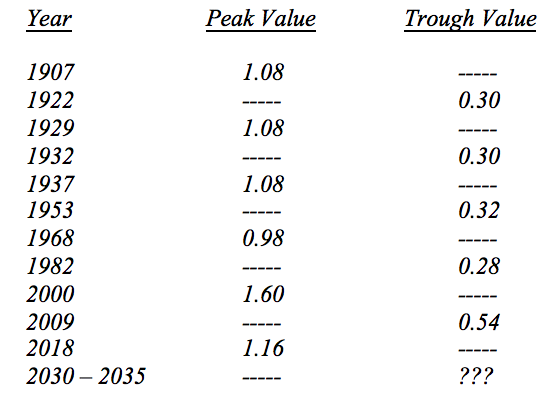
As the above table makes clear, Tobin’s Q Ratio is flashing red as well. Other indicators, such as Household Ownership of Equities could get added to the mix, but would only produce a similar conclusion. When combined, these statistically proven indicators demonstrate that Equity Investors should expect 10 Year Returns of less than 3% per year and the potential for 0% or less. How we got here matters less for the average investor than the reality that this is where we are.
The seeds of how the market may begin this journey away from peak valuations start with Corporate Profits. As the following chart illustrates, Corporate Profits to GDP stand well above any level recorded since World War II and even above the levels generated due to war time profits during that war:
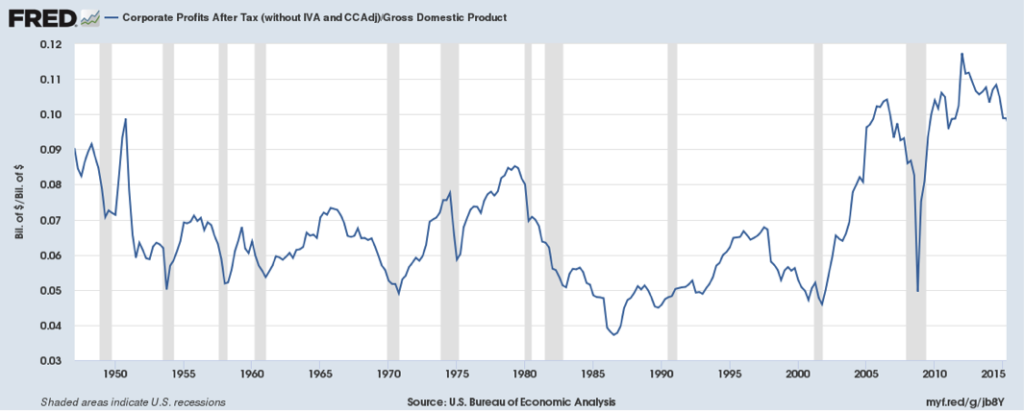
This level of profits would not be worrisome except for the way it got produced: at the expense of labor. This shows clearly in the following chart:
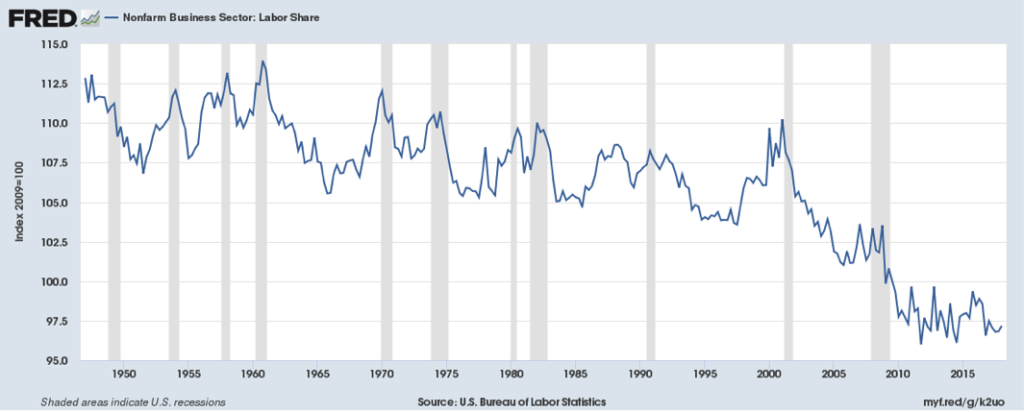
In other words, the record corporate profit margins came at the expense of labor income. While corporations possess vast resources which they can deploy to great effect in political causes to shape the law to their benefit, they stand at one disadvantage: they do not get a vote. And the reality facing most voters is the following chart:
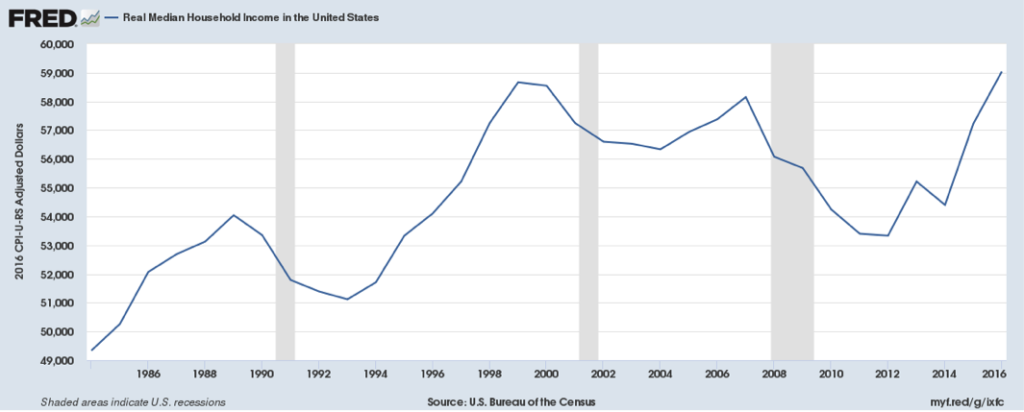
Real Median Household Income did not grow over the past 20 years. And the prime culprit appears a shift from workers to the corporate sector. As workers vote and clearly began to demand a larger piece of the pie starting in 2016, a shift back from corporations to workers of at least a portion of this income appears likely. And the easiest way to force this shift without any legislation appears in process: keep Unemployment low, Tariff foreign goods out of the marketplace to increase demand for domestic labor, and allow the economy to continue to grow at a rapid pace.
Even if these political forces did not exist, other economic forces appear in play that will impinge on this corporate largess in the form of business basics called Capital Expenditures and R&D. As the following table shows, originally printed in The Cult of Indexing: All Hands on Deck, 1960s Aheadin January 2018, Capital Expenditures to Revenue stand far below normalized levels prior to 2000:
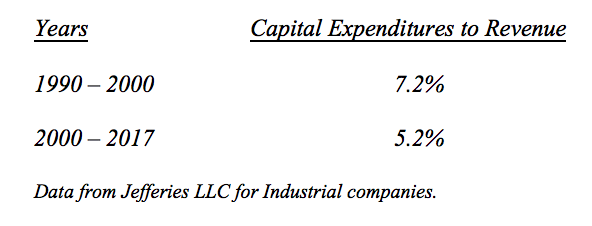
Faster growth means normal productivity in a plant cannot meet demand. Thus, Investment must rise in the form of Capital Expenditures and R&D. Capital Expenditures for the S&P 500 rose 21% year-over-year in Q1. Should this continue for the full year, as indicated by many corporations, then Capital Expenditures would begin to consume a larger portion of Cash Flow in 2019. (2018 Cash Flow benefits from the tax cuts enacted by Congress.) For example, Caterpillar Inc. raised its Cap Ex from $900 million in 2017 to $1.3 billion this year. Spending is expected to continue to rise in 2019. Amazon, Google, and Facebook expect to increase their aggregate Cap Ex to $93 billion this year, up 47% from last year. This is after rising 26% in 2017. Interfor plans to raise its spending on Southern US sawmills from $95 million in 2017 to over $150 million in 2018. On the R&D side, Emerson Electric plans to increase R&D by 28%. Deere & Company raised R&D by 19%. The 10 largest Technology companies are expected to increase R&D by 24%.
Lastly, corporations benefitted from low interest rates engineered by the Federal Reserve since 2009. This allowed Interest Expense to fall as a percent of revenues for the S&P 500:

Should interest rates return to levels held as recently as 2000 – 2009, then a portion of profits would disappear from the bottom line. With faster growth and inflation, this seems a likely occurrence.
For the Equity Markets, the party continues onward. But the battalions to force reversion to the mean for Corporate Profits and Free Cash Flow continue to march onto the battlefield. They include Labor, Capital Expenditures/ R&D, and Interest Expense. These forces gathered sufficient strength to end the advance over the past two years. Over the next decade, as they gather additional reinforcements, they will advance steadily across the battlefield, reclaiming lost ground. For the Equity Markets, their advance will mean lower valuations. And despite growing corporate earnings, this Molotov Cocktail of forces should lead to much lower Equity Markets returns than over the past decade. For the Equity Investor, it will be Where’s The Cash? (Data from Jefferies LLC, Credit Suisse, Census Bureau, S&P, Yardeni Research, Inc, and Advisor Perspectives coupled with Green Drake Advisors analysis.)
Confidential – Do not copy or distribute. The information herein is being provided in confidence and may not be reproduced or further disseminated without Green Drake Advisors, LLC’s express written permission. This document is for informational purposes only and does not constitute an offer to sell or solicitation of an offer to buy securities or investment services. The information presented above is presented in summary form and is therefore subject to numerous qualifications and further explanation. More complete information regarding the investment products and services described herein may be found in the firm’s Form ADV or by contacting Green Drake Advisors, LLC directly. The information contained in this document is the most recent available to Green Drake Advisors, LLC. However, all of the information herein is subject to change without notice. ©2018 by Green Drake Advisors, LLC. All Rights Reserved. This document is the property of Green Drake Advisors, LLC and may not be disclosed, distributed, or reproduced without the express written permission of Green Drake Advisors, LLC.
